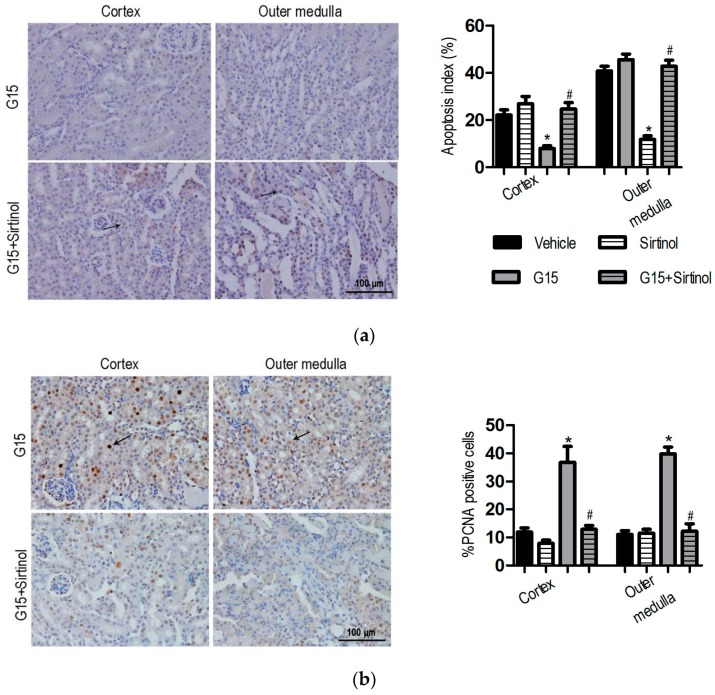
Figure 5.
Mice were treated as described in Figure 4. The data were expressed as the mean ± SEM; n = 6; * p < 0.05 vs. Vehicle; # p < 0.05 vs. G15. (a) Representative photomicrograph of TUNEL-positive from the G15 and G15 + Sirtinol groups and the percentage of positive cells were illustrated; (b) Representative photomicrograph of PCNA-positive from the G15 and G15 + Sirtinol groups and the percentage of positive cells were illustrated. Original magnification, 400×. The black arrows indicate the positive cells.

