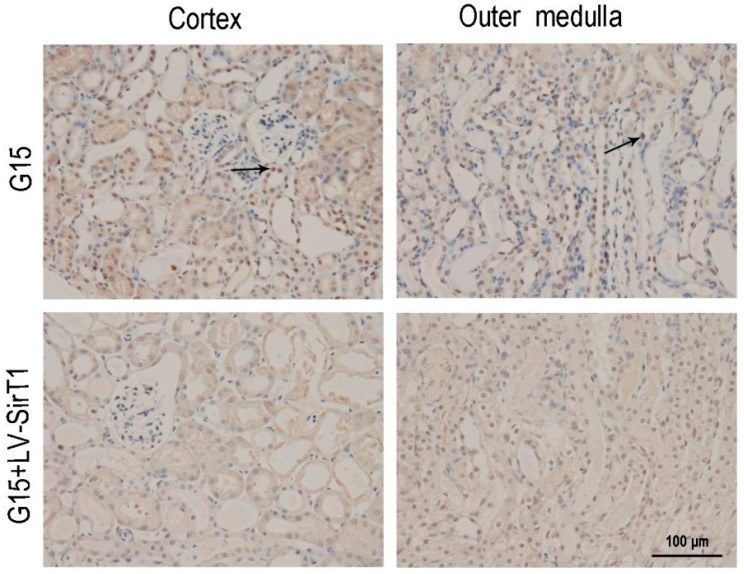
Figure A7.
IHC analyses demonstrating the knock-down of SIRT1 in kidney tissues. Mice were treated as described in supplemental Figure 7. Representative photomicrograph of SIRT1-stained kidney tissues from the G15 and G15 + LV-shSIRT1 groups. Original magnification, 400×. The black arrows indicate positive cells.

