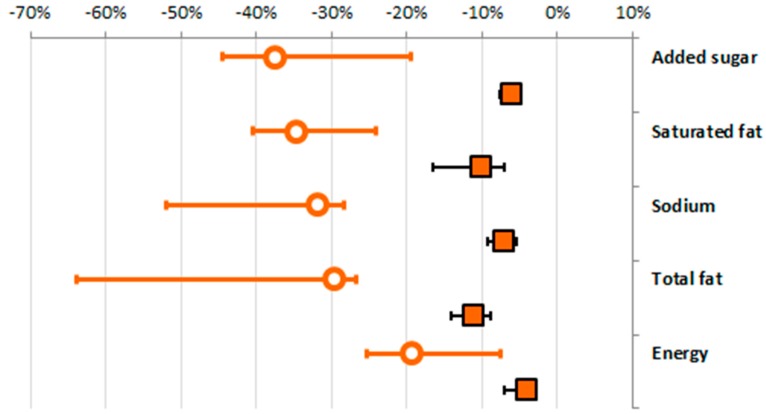
Figure 3.
Average minimum change (%) required in NNPS fail products to achieve NNPS standards (circle), and overall modelled change (%) in all products amenable to reformulation (squares), across all five national datasets (weighted average, min, max). Circles: change required in NNPS Fail products for the specific nutrient; squares: overall change in the average nutrient content across all products analysed.

