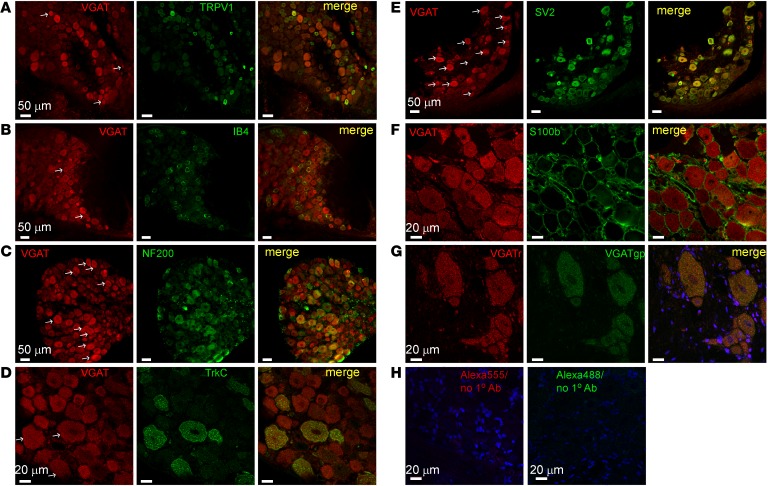
Figure 3. Expression of VGAT in rat DRG.
(A–G) Shown is the colabeling of VGAT with sensory neuron markers TRPV1 (A), IB4 (B), NF200 (C), and TrkC (D) as well as with SV2 (E) and satellite glia marker S100b (F). In A–E, arrows indicate examples of neurons expressing both VGAT and the corresponding marker. (G) Costaining of the same DRG section with 2 different antibodies raised in rabbit (VGATr) and guinea pig (VGATgp). (H) Control for secondary antibodies used. Micrographs within each panel are of the same magnification; scale bars are labeled on the left image in each panel. Somatic diameter distribution of VGAT-positive DRG neurons is given in Supplemental Table 2.

