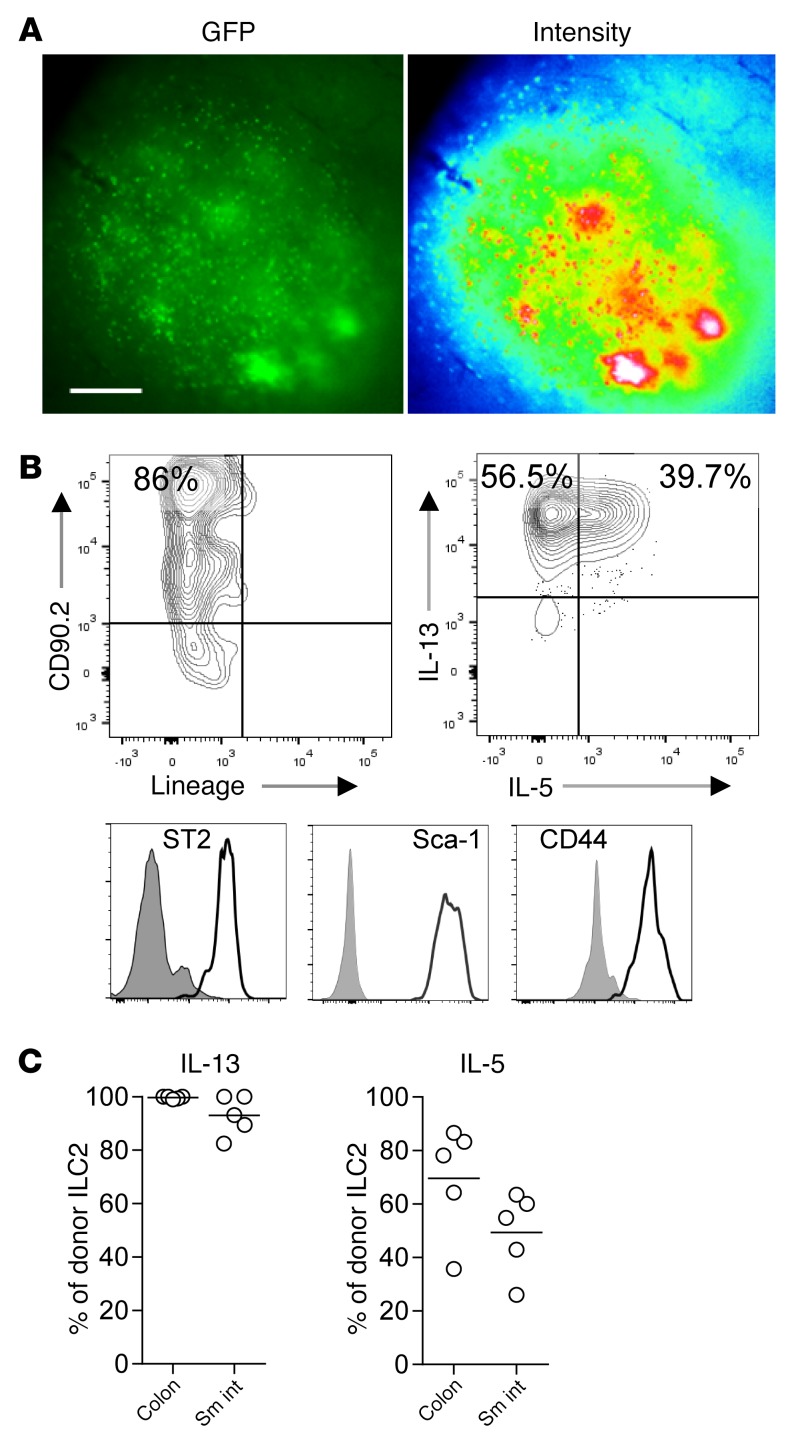
Figure 3. ILC2 evaluation in tissues after transplant.
(A) Fluorescence microscopy of B6-GFP ILC2s in PPs 12 days after BMT; GFP imaging (left) and signal intensity (right). Magnification, ×40; exposure, 200 ms. Data represent 3 experiments; n = 6 each. (B) Flow cytometry plots of B6-GFP ILC2 phenotype in the LP of BMT recipients 12 days after transplant, gated first as GFP+. (C) Percentage of B6-GFP ILC2s expressing IL-13 and IL-5; average ± SEM. Results represent 3 independent experiments; n = 5 each. Sm int, small intestine.

