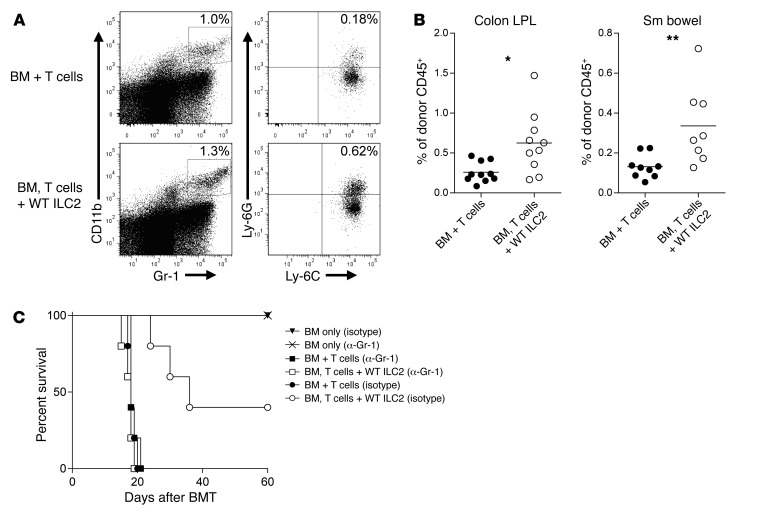
Figure 5. Co-transplantation of WT ILC2s increases MDSC numbers in the GI tract.
(A) Representative density plots of CD11b+Gr-1+Ly-6C+Ly-6G+ MDSCs (gated on donor CD45+cells) 12 days after BMT. (B) Frequencies of MDSCs as a percentage of CD45+ granulocytes in the colon and small (Sm) bowel of BMT recipients 12 days after transplant. Results represent 2 independent experiments; bar graphs are average ± SEM. Student’s t test with Welch’s correction, *P < 0.05, **P < 0.01. (C) Kaplan-Meier plot showing results of Gr-1 depletion. Lethally irradiated B6D2 mice (950 cGy) received 3.0 × 10⁶ TCD BM (BM only), BM plus 4.0 × 10⁶ total splenic T cells (BM + T cells), or BM plus T cells with 4.0 × 10⁶ IL-33–activated ILC2s (BM, T cells + WT ILC2). One group additionally received 200 μg anti–Gr-1 (α-Gr-1), with another group receiving isotype control antibody twice weekly beginning 7 days after transplant. Results of 1 representative of 2 independent experiments are shown; n = 6 per group.

