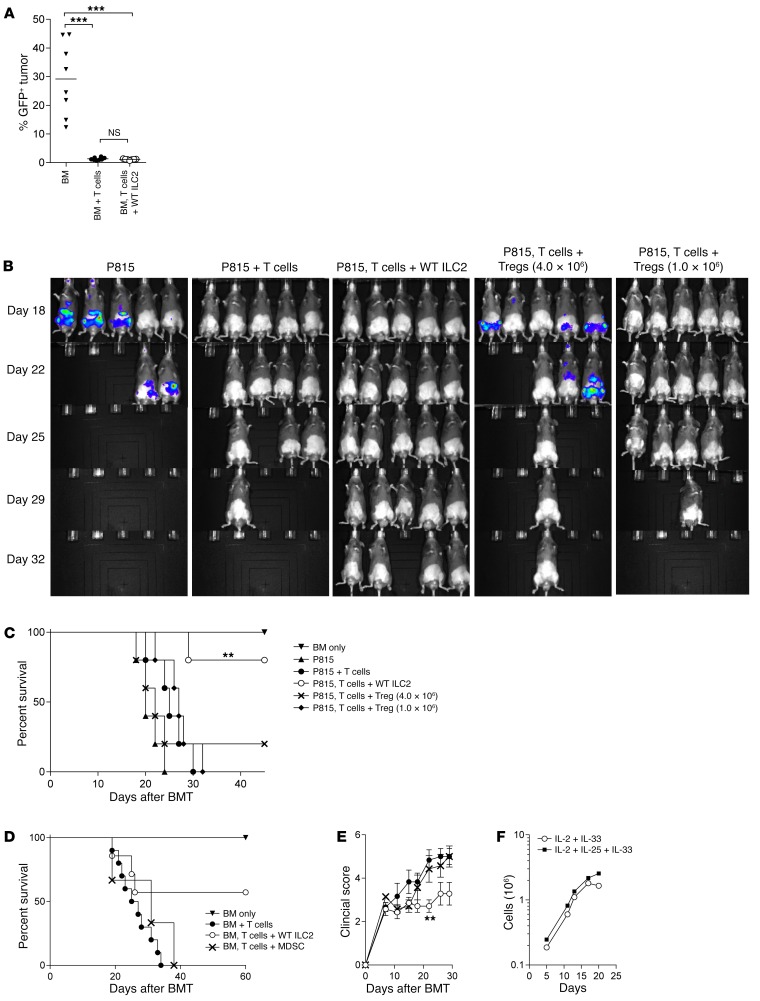
Figure 8. Comparison of ILC2s and other cellular therapies for GVHD.
(A) Percentage of GFP+ BC-CML tumor in host spleen 21 days after BMT in the B6-into-B6D2 model. Results represent 2 independent experiments (n = 8 each). Analysis by Student’s t test with Welch’s correction, ***P < 0.001. (B) IVIS imaging of luc-P815 tumor in B6D2 BMT recipients 15 days after transplant comparing recipients of BM and luc-P815 cells (BM only); BM with splenic T cells and luc-P815 cells (BM + T cells); BM, splenic T cells, Tregs, and luc-P815 cells (BM, T cells + Treg); and BM, splenic T cells, WT ILC2s, and luc-P815 cells (BM, T cells + WT ILC2). Results represent 2 independent experiments; n = 5 in each group. (C) Kaplan-Meier plot comparing the survival of the allo-SCT recipients described in B. Log-rank (Mantel-Cox) test, **P < 0.01. (D) Kaplan-Meier plot comparing the survival of recipients of allo-SCT (B6 into B6D2 model) that received BM alone (BM only); BM and splenic T cells (BM + T cells); and those that received BM and splenic T cells at the time of transplant with either WT ILC2s (BM, T cells + WT ILC2) or BM-MDSCs (BM, T cells + MDSC) 7 days after BMT. Results represent 2 combined experiments (n = 10 or more per group). Log-rank (Mantel-Cox) test. (E) Clinical scores of recipients from the survival study in D. **P < 0.01 by 2-way ANOVA, with Bonferroni correction for repeated measures of multiple comparisons. (F) Expansion of human ILC2s (hILC2) from SR-1–stimulated CD34+ cord blood cells in the indicated cytokines. hILC2s were enumerated as CRTH2+CD161–Lin– cells (Supplemental Figure 6F) from days 3 to 21; n = 3.

