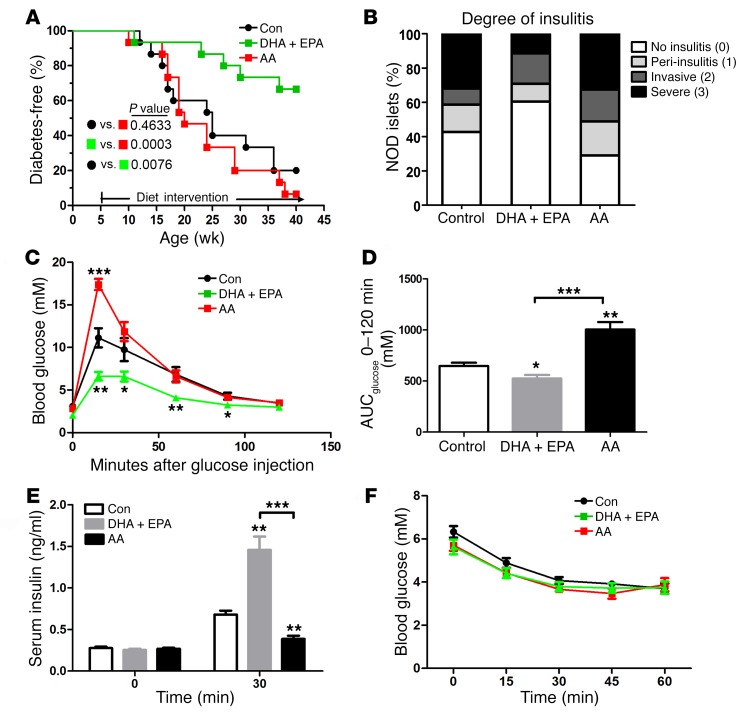
Figure 1. ω-3 PUFAs ameliorate the development of T1D and normalize glucose metabolism in NOD mice.
(A) Blood glucose concentrations in 3 groups of NOD mice on varied diets were monitored weekly until 40 weeks of age. Sustained hyperglycemia for 2 consecutive weeks (>11.11 mmol/l) marked the onset of disease, which was used to create a life table to determine the incidence of diabetes (n = 15/group). Statistical calculation was done using a Mantel-Cox log-rank test. (B) Sections (4-μm-thick) of pancreas from 20-week-old NOD mice were formaldehyde fixed, paraffin embedded, and stained with H&E (n =7/group). Islets were sorted into the following 4 categories on the basis of the relative degree of immune infiltration: no insulitis (0), peri-insulitis (1), invasive insulitis (2), or severe insulitis (3). Representative pancreatic sections are shown in Supplemental Figure 1. The differences in severe insulitis between DHA plus EPA group and the control group (P < 0.0001) and between the DHA plus EPA group and the AA group (P = 0.0008) were significant. The finding of no insulitis in the DHA plus EPA group was increased compared with the control (P = 0.02) and AA (P < 0.0001) groups. Statistical calculation was done using Pearson’s χ2 test. (C) Glucose tolerance tests (GTTs) in NOD mice fed a control, AA, or DHA plus EPA diet (n = 15/group) at 20 weeks of age. (D) AUC for GTTs performed in 3 groups of NOD mice fed different diets. (E) Serum insulin concentrations during the GTT at the indicated time points (n = 10/group). (F) Insulin tolerance tests (n = 10/group). (C–E) *P < 0.05, **P < 0.01, and ***P < 0.0001 versus the control group (Student’s t test). Data are representative of 2 independent experiments. All values represent the mean ± SEM.

