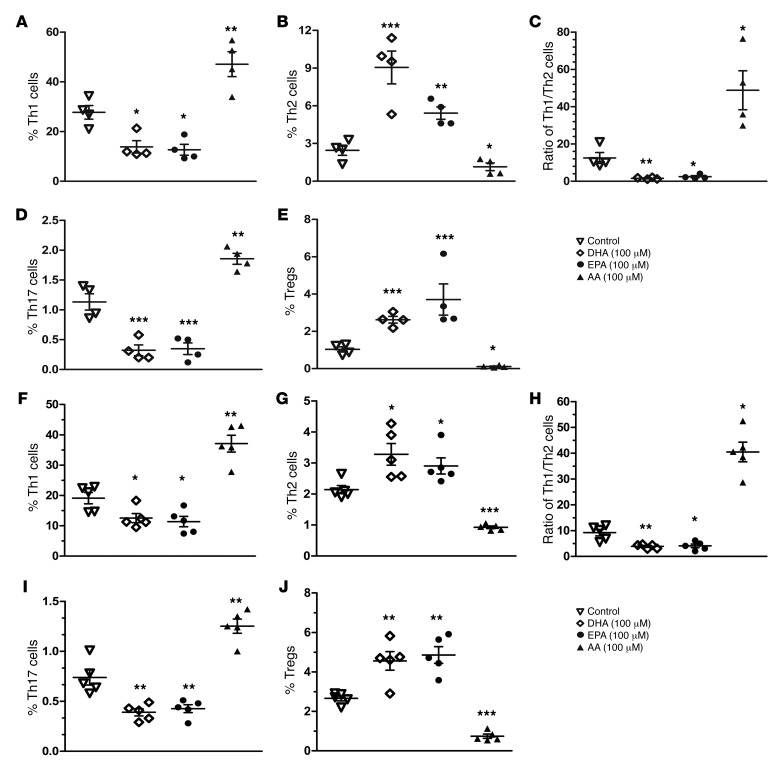
Figure 10. ω-3 and ω-6 PUFAs readjust CD4+ T cell differentiation in PBMCs from T1D patients and nondiabetic donors in vitro.
Quantification of the percentage of intracellular staining of IFN-γ+, IL-4+, IL-7+, and CD25+FoxP3+ Th cells in PBMCs from 4 T1D patients (A–E) and 5 nondiabetic donors (F–J). Cells were cultured for 24 hours under PMA and ionomycin stimulation in the presence of DHA, EPA, and AA (100 μM) added at the time of activation. Representative flow cytometric images are shown in Supplemental Figures 9 and 10. *P < 0.05, **P < 0.01, and ***P < 0.0001 compared with the control group (Student’s t test). Each point represents an individual patient or donor, and the data are representative of 3 independent experiments. All values represent the mean ± SEM.

