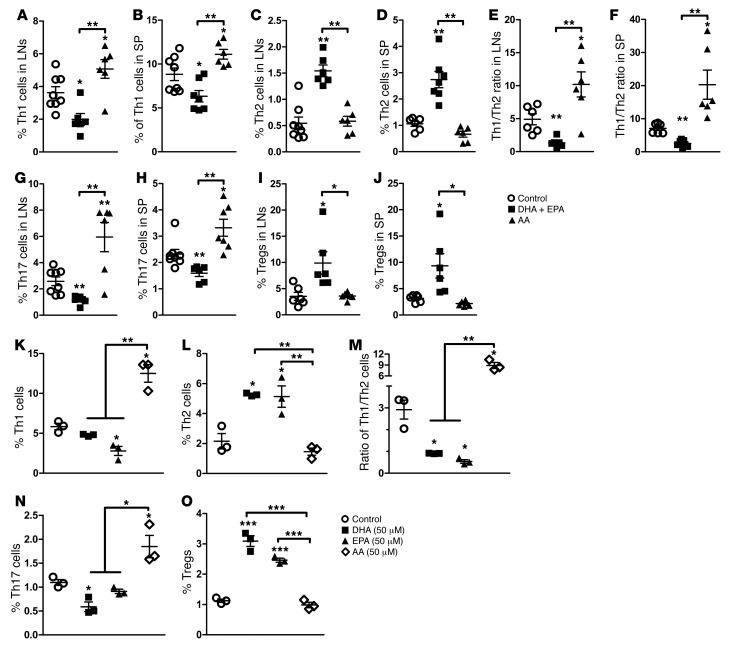
Figure 2. Modulation of Th cells by ω-3 and ω-6 PUFAs in vivo and in vitro.
(A–J) Percentage of IFN-γ+, IL-4+, IL-7+, and CD25+FoxP3+ Th cells in spleens and LNs of nondiabetic NOD mice fed a control, DHA plus EPA, or AA diet. NOD mice were sacrificed at 20 weeks of age, following dietary intervention, and their spleens and LNs were harvested. Each point represents an individual mouse, and the data are representative of 3 independent experiments (n =6–8/group). Representative flow cytometric images are shown in Supplemental Figure 3. (K–O) Quantification of the percentage of intracellular staining of IFN-γ+, IL-4+, IL-7+, and CD25+FoxP3+ Th cells from 10-week-old nondiabetic NOD mice. Cells were cultured for 24 hours under PMA and ionomycin stimulation in the presence of DHA, EPA, and AA (50 μM), added at the time of activation. Data are representative of 3 independent experiments (n = 3/group). Representative flow cytometric images are shown in Supplemental Figure 5. *P < 0.05, **P < 0.01, and ***P < 0.0001 versus the control group (Student’s t test). Values represent the mean ± SEM.

