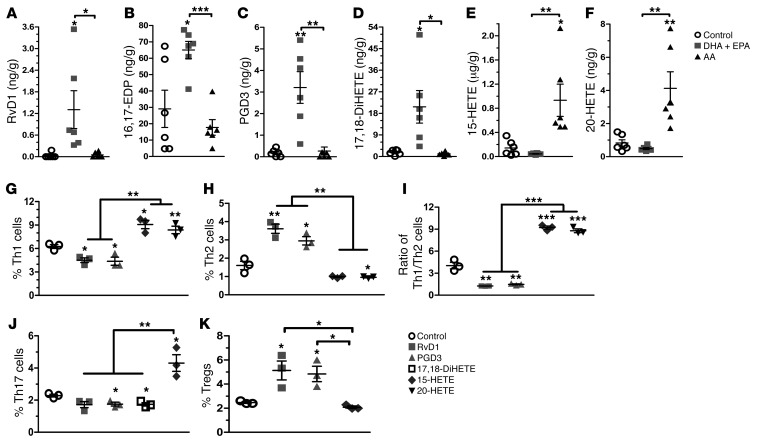
Figure 3. Diverse metabolic production of ω-3 PUFAs regulates Th cell differentiation.
(A–F) Presence of different eicosanoids from ω-3 or ω-6 PUFAs in pancreas samples from NOD mice fed a control, DHA plus EPA, or AA diet (n = 6/group). (G–K) Quantification of the percentage of intracellular staining of IFN-γ+, IL-4+, IL-7+, and CD25+ FoxP3+ Th cells from 10-week-old nondiabetic NOD mice. Cells were cultured for 24 hours under PMA and ionomycin stimulation in the presence of distinctive PUFA metabolites (0.1 μg/ml), added at the time of activation (n = 3/group). Representative flow cytometric images are shown in Supplemental Figure 7. *P < 0.05, **P < 0.01, and ***P < 0.0001 versus the control group (Student’s t test). Data are representative of 3 independent experiments. All values represent the mean ± SEM.

