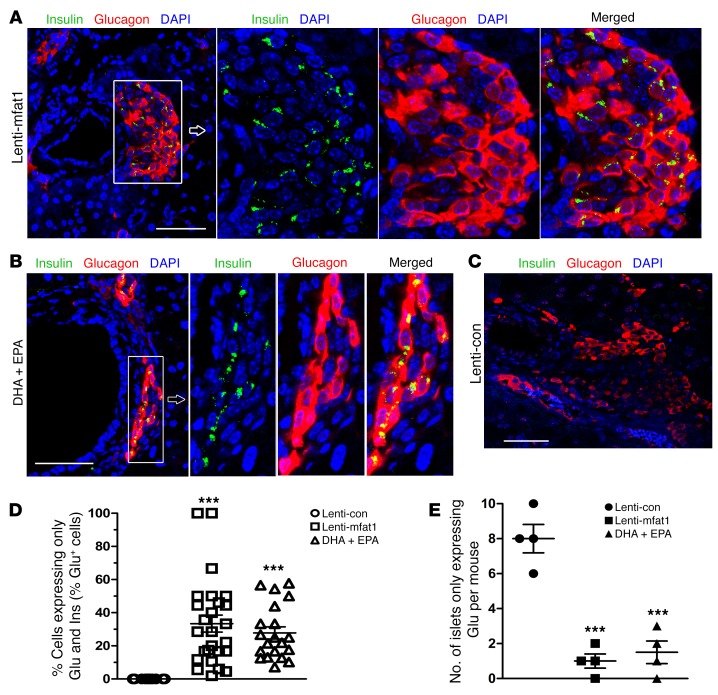
Figure 8. Islet and β cell regeneration and colocalization of α cells and β cells in diabetic NOD mice treated with ω-3 PUFAs.
Mice were sacrificed and pancreases harvested at 9 weeks following lentivirus treatment and DHA plus EPA dietary intervention. (A–C) Confocal images of colocalization (yellow areas) of α cells and β cells detected in islets and cells near the pancreatic duct in lenti-mfat-1–treated and DHA plus EPA dietary intervention groups of diabetic NOD mice. β cells (insulin, green), α cells (glucagon, red), and nuclei (DAPI, blue) are shown. Scale bars: 50 μm. Original magnification: ×400. Images are representative of 3 biological replicates. (D) Quantification of islets detected by glucagon and insulin (Ins and Glu) colocalization (n = 20–26 islets/group). (E) Quantification of islets expressing only glucagon (Glu) and no insulin (n = 4/group) and that appeared adjacent to pancreatic ducts. ***P < 0.0001 versus the lenti-con group (ANOVA). All values represent the mean ± SEM.

