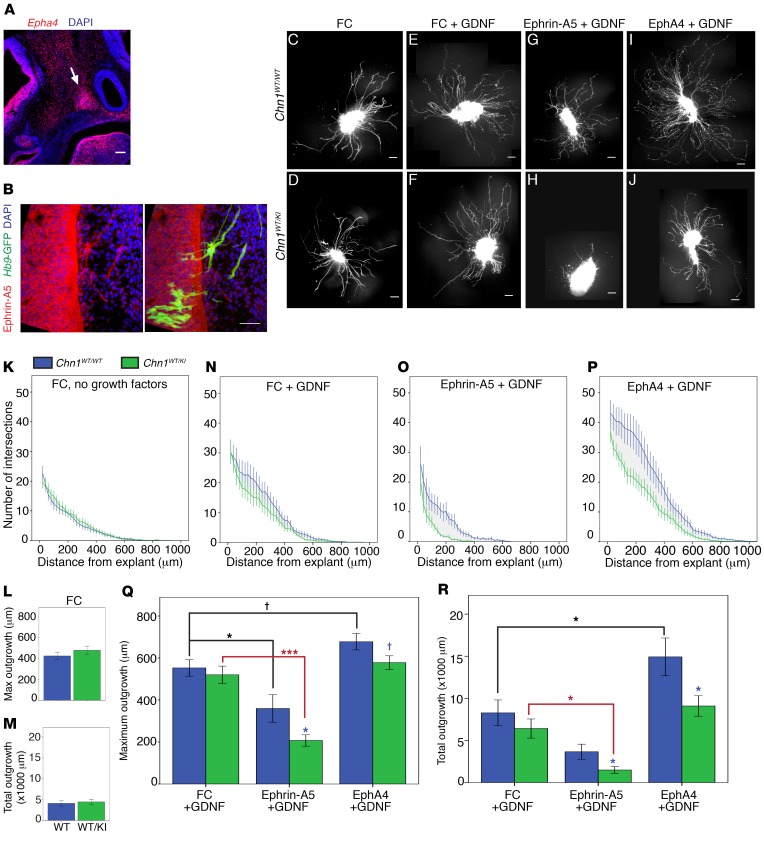
Figure 6. Chn1KI alters ephrin forward and reverse signaling in abducens neurons.
(A) Sagittal E11.5 WT embryo with Epha4 localization (red) in mesenchyme and EOM anlage. Arrow, EOM anlage; blue, DAPI. Scale bar: 100 μm. (B) Sagittal E11.5 WT embryo with ephrin-A5 protein localization in abducens nerve bundles. Red, ephrin-A5; green, Hb9-GFP–positive abducens projections; blue, DAPI. Scale bar: 50 μm; n = 2. (C–J) Sample images of E11.5 Chn1WT/WT (top row) and Chn1WT/KI (bottom row) Hb9-GFP–positive abducens nucleus explants grown in 50 ng/ml FC without growth factor (C and D) or with 50 ng/ml FC+25 ng/ml GDNF (E and F), 50 ng/ml ephrin-A5+25 ng/ml GDNF (G and H), or 1 μg/ml EphA4+25 ng/ml GDNF (I and J). Scale bars: 100 μm. (K–M) Sholl analysis of E11.5 Chn1WT/WT (blue, n = 28 explants) and Chn1WT/KI (green, n = 23 explants) abducens explants cultured in 50 ng/ml FC (K: 7 experiments). (L and M) Quantification of average maximum outgrowth (L) and total outgrowth (M) from K. (N–R) Sholl analysis of E11.5 Chn1WT/WT (blue) and Chn1WT/KI (green) abducens explants cultured in 50 ng/ml FC with 25 ng/ml GDNF (Chn1WT/WT: n = 13, Chn1WT/KI: n = 7, 4 experiments) (N); 50 ng/ml ephrin-A5 with 25 ng/ml GDNF (Chn1WT/WT: n = 11, Chn1WT/KI: n = 13, 5 experiments) (O); and 1 μg/ml EphA4 with 25 ng/ml GDNF (Chn1WT/WT: n = 19, Chn1WT/KI: n = 19, 6 experiments) (P). (Q and R) Quantification of average maximum outgrowth (Q) and total outgrowth (R) from N–P. †P < 0.07, *P < 0.05, ***P < 0.001; black asterisks, comparisons within Chn1WT/WT explant between three cues; red asterisks, comparisons within Chn1WT/KI between cues, 1-way ANOVA with Dunnett’s test; blue asterisks, comparisons between Chn1WT/WT and Chn1WT/KI within each cue by unpaired 2-tailed t test.

