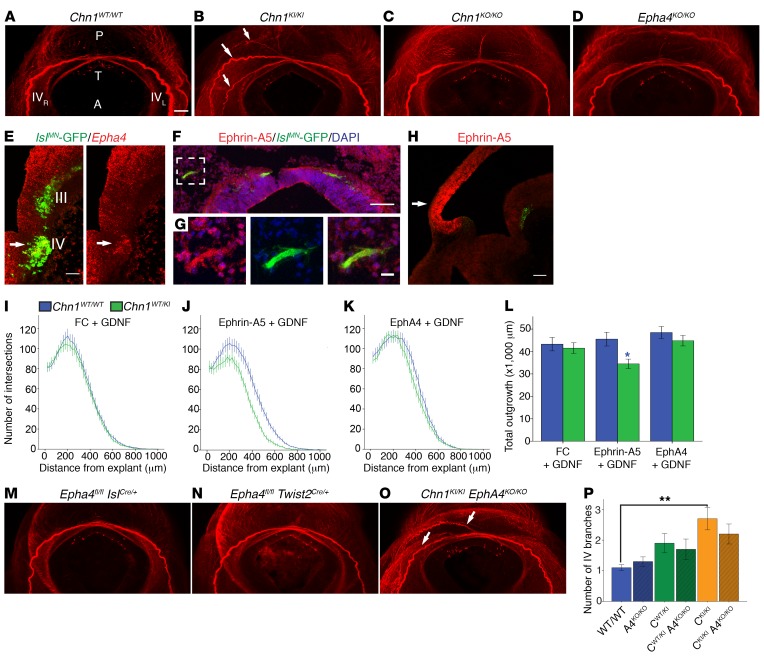
Figure 9. Chn1KI/KI trochlear nerve branching abnormalities are unaltered by Epha4KO allele.
(A–D) Transverse view of crossing trochlear nerves (IV) in E11.5 Chn1WT/WT (A; n = 4), Chn1KI/KI (B; n = 4), Chn1KO/KO (C; n = 4), and Epha4KO/KO (D; n = 4) embryos. P, posterior; A, anterior; T, tectum; IVR and IVL, right and left trochlear nerves; arrows, aberrant trochlear branches; red, neurofilament. Scale bars: 100 μm. (E) Epha4 expression in trochlear nucleus (arrow); red, Epha4; green, IslMN-GFP; III, oculomotor; IV, trochlear nuclei. Scale bar: 50 μm. (F and G) Ephrin-A5 protein in peripheral trochlear axons. Scale bar: 100 μm. White box: enlargement in (G) with 20 μm scale bar. Red, ephrin-A5; green, IslMN-GFP; blue, DAPI. (H) Ephrin-A5 (red) and Hb9-GFP (green) fluorescence ISH on sagittal E11.5 WT brainstem. Arrow, tectum. (I–K) Sholl analysis of E11.5 Chn1WT/WT (blue) and Chn1WT/KI (green) trochlear explants cultured in 50 ng/ml FC with 25 ng/ml GDNF (I; Chn1WT/WT: n = 25, Chn1WT/KI: n = 17, 4 experiments); 50 ng/ml ephrin-A5 with 25 ng/ml GDNF (J; Chn1WT/WT: n = 24, Chn1WT/KI: n = 15, 4 experiments); and 1 μg/ml EphA4 with 25 ng/ml GDNF (K; Chn1WT/WT: n = 19, Chn1WT/KI: n = 21, 4 experiments). (L) Quantification of total outgrowth (AUC); *P < 0.05; blue asterisk, comparison between Chn1WT/WT and Chn1WT/KI within each cue by unpaired 2-tailed t test. (M–O) Transverse view of crossing trochlear nerves in E11.5 Epha4fl/fl IslCre/+ (M; n = 5), Epha4fl/fl Twist2Cre/+ (N; n = 3), and Chn1KI/KI Epha4KO/KO (O; n = 5) embryos. Arrows, aberrant trochlear branches; red, neurofilament. (P) Quantification of trochlear branching. **P < 0.01, 1-way ANOVA with Tukey’s test. Four individual images taken with a ×5 objective were tiled to generate the stitched images shown in panels A–D and M–O, and scale is as per bar in A. Graphs represent mean ± SEM.

