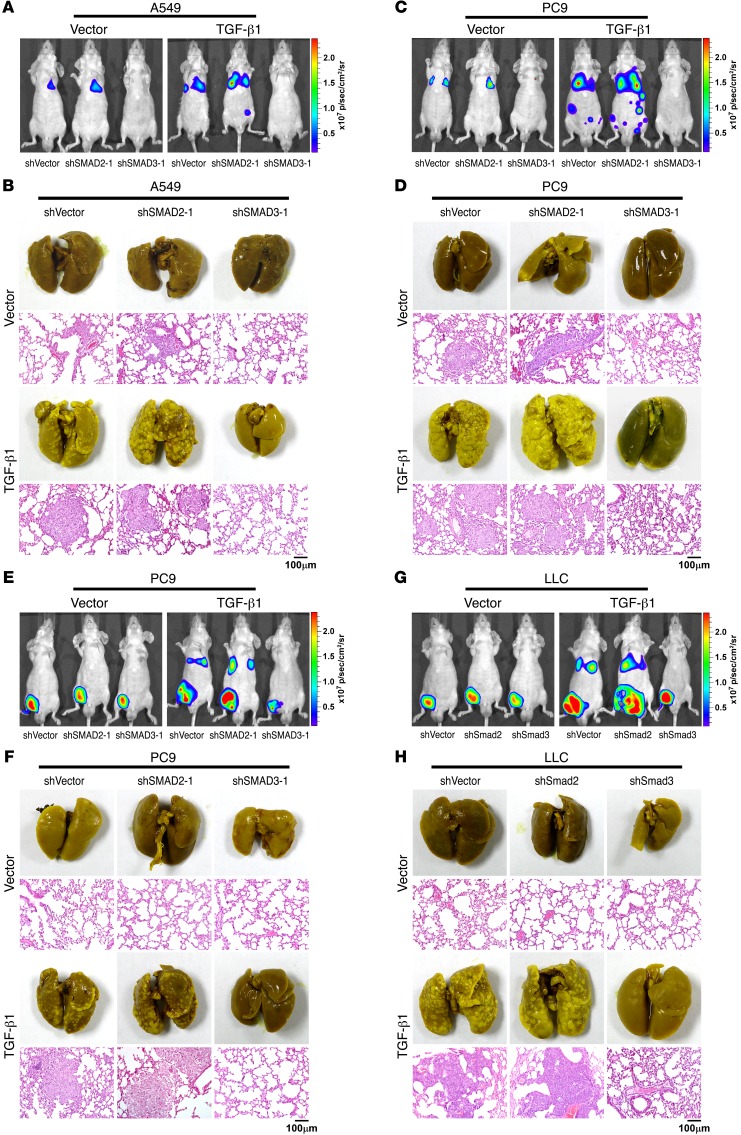
Figure 2. TGF-β–induced metastasis of NSCLC is suppressed by SMAD2 and promoted by SMAD3.
(A–D) Mice were intravenously tail-vein injected with the indicated NSCLC cells. Luciferase live-cell imaging (A and C), picric acid staining of metastatic foci, and H&E staining of lung tissue (B and D) indicated that the knockdown of SMAD2 promoted, whereas knockdown of SMAD3 suppressed, the survival and metastasis of NSCLC cells expressing TGF-β. Luciferase-labeled images of live mice at different time points following intravenous tail-vein injection of the indicated NSCLC cells are presented in Supplemental Figure 2A. Representative images shown are from 2 independent experiments, with 6 mice per group in each independent experiment. Scale bars: 100 μm. (E–H) Mice were subcutaneously injected with the indicated NSCLC cells into inguinal folds. Luciferase live-cell imaging (E and G), picric acid staining of metastatic foci, and H&E staining of lung tissue (F and H) indicated that knockdown of SMAD2 promoted, whereas knockdown of SMAD3 suppressed, the metastasis potential of NSCLC cells. Luciferase-labeled images of live mice at different time points following subcutaneous injection of the indicated NSCLC cells into inguinal folds are presented in Supplemental Figure 2J. Representative images are from 2 independent experiments, with 6 mice per group in each independent experiment. Scale bars: 100 μm. p, photons; sr, steradian.

