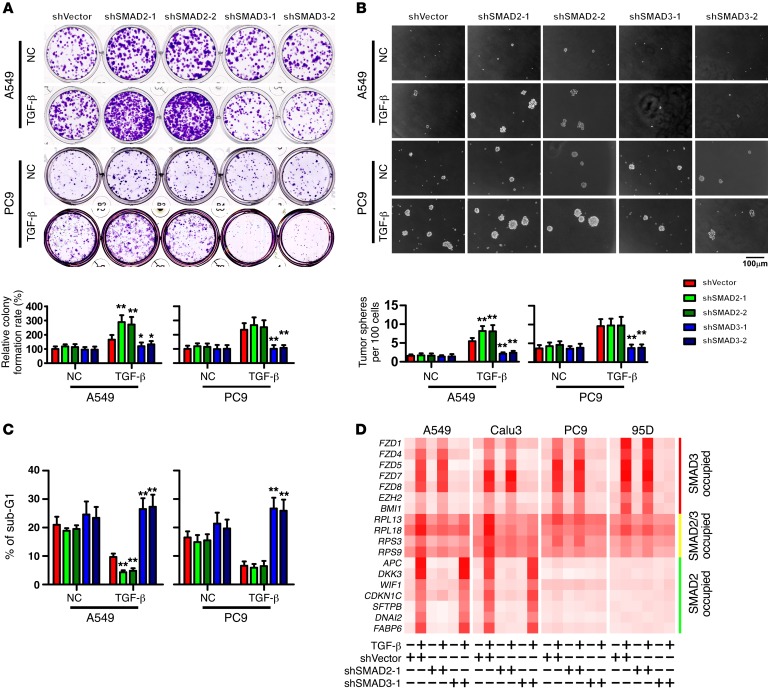
Figure 3. SMAD2 mediates a tumor-suppressive transcriptional program, whereas SMAD3 mediates a pro-cell survival transcriptional program, in NSCLC cells.
(A–C) Analyses of colony formation in an adherent culture (A), tumor sphere formation (B), and sub-G1 DNA content of detached cell (C) were performed in the indicated cells. Representative images were derived from 3 independent experiments. Error bars represent the mean ± SD of 3 independent experiments. *P < 0.05 and **P < 0.01, by ANOVA with Dunnett’s t test. Scale bar: 100 μm. (D) qPCR analysis of the expression levels of target genes distinctly specific for, or commonly shared by, SMAD2 and SMAD3 in the indicated cells. Heatmaps represent the mRNA levels. NC, the vehicle control of TGF-β solution.

