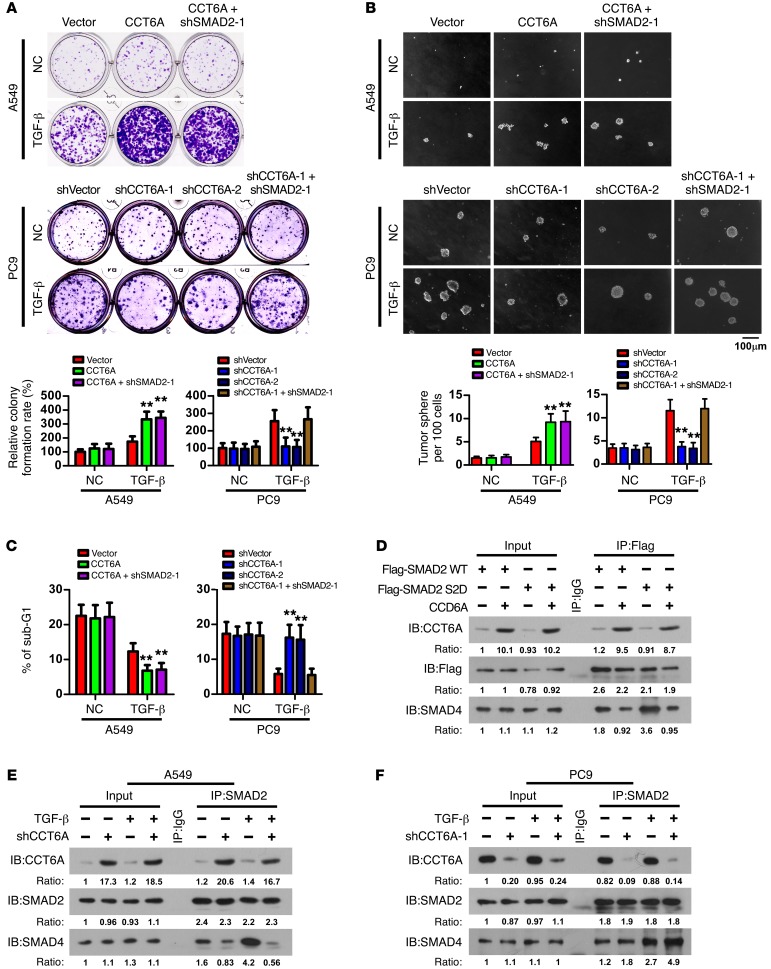
Figure 5. CCT6A promotes NSCLC cell survival and blocks SMAD2-SMAD4 interaction.
(A–C) Analyses of colony formation in an adherent culture (A), tumor sphere formation (B), and sub-G1 DNA content of detached cells (C) for the indicated cells. Representative images were derived from 3 independent experiments. Error bars represent the mean ± SD of 3 independent experiments. **P < 0.01, by ANOVA with Dunnett’s t test. Scale bar: 100 μm. (D) Immunoprecipitation analysis indicated that CCT6A attenuated the interaction of SMAD4 with both the WT and the phosphorylation mimicry mutant SMAD2 (S2D). Representative blots were derived from 3 independent experiments. (E and F) Immunoprecipitation analysis showed that in A549 cells, CCT6A overexpression attenuated SMAD2-SMAD4 interaction (E), whereas in PC9 cells, silencing of CCT6A enhanced SMAD2-SMAD4 interaction (F). Representative blots (IB) were derived from 3 independent experiments.

