. 2017 Apr 11;6:e23232. doi: 10.7554/eLife.23232

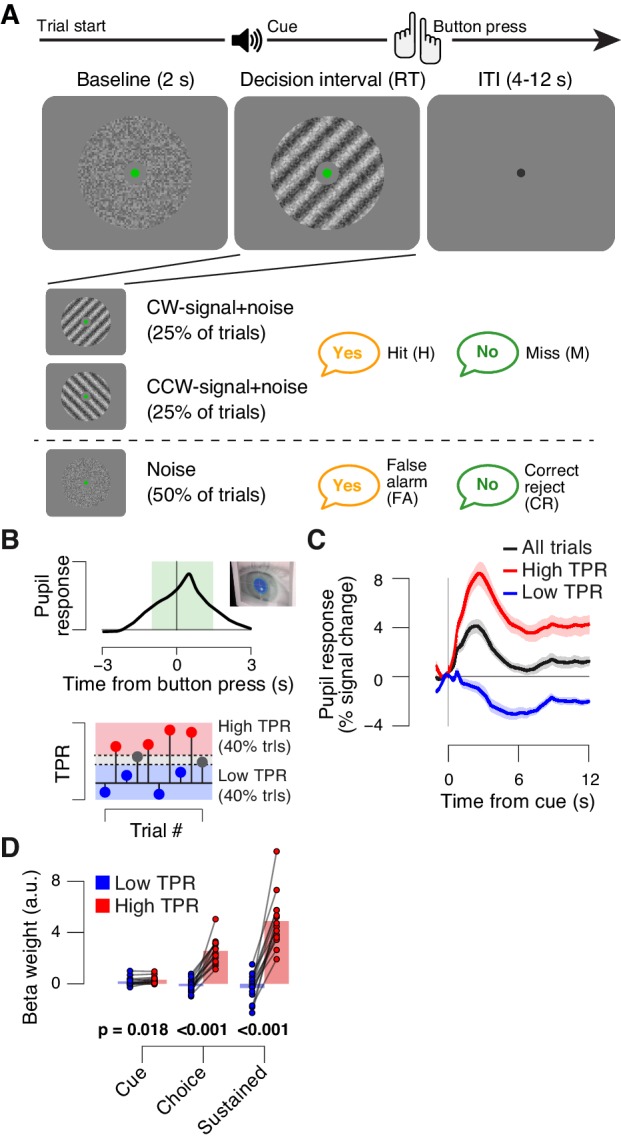
Figure 1. Behavioral task and task-evoked pupil responses.

(A) Yes-no contrast detection task. Top: schematic sequence of events during a signal+noise trial. Subjects reported the presence or absence of a faint grating signal superimposed onto dynamic noise. Bottom left: the signal, if present, was oriented clockwise or counter clockwise on different blocks (known to the subject beforehand). Signal contrast is high for illustration only. Bottom right: trial types. (B) Quantifying task-evoked pupillary response (TPR) amplitude. Top: mean TPR time course of an example subject. Green box, interval for averaging TPR values on single trials. Bottom: trials were pooled into three bins of TPR amplitudes (lowest/highest 40% and intermediate 20%). (C) TPR time course for the three bins. (D) Mean beta weights of transient (cue, choice) and sustained input components under low vs. high TPR, estimated with a general linear model (see Materials and methods; Figure 1—figure supplement 1A,B), separately for low and high TPR trials. Panels C, D: group average (N = 14); shading, s.e.m.; data points, individual subjects; stats, permutation test.
DOI: http://dx.doi.org/10.7554/eLife.23232.003

Figure 1.

Figure 1—figure supplement 1. Linear modeling of TPR.
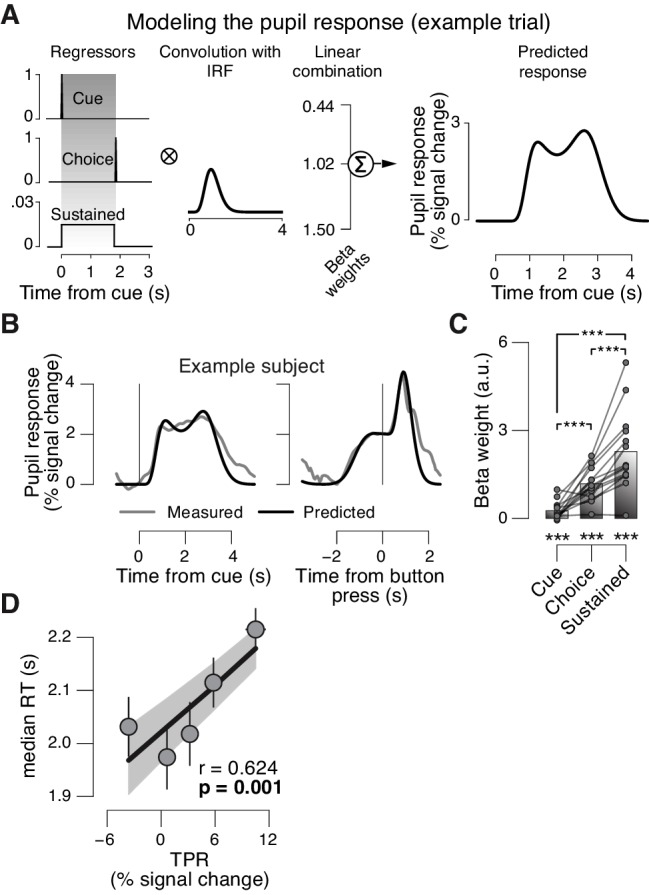
Figure 1—figure supplement 1.

The peripheral system (i.e., nerves and the muscles of the iris [McDougal and Gamlin, 2008]) that transforms central neural inputs originating from the brainstem into TPR is sluggish and acts as a low-pass filter (Hoeks and Levelt, 1993; Korn and Bach, 2016). (A) Linear modeling of TPR (see Materials and methods). We used a previously established general linear model (GLM) to estimate the relative contribution of three putative underlying neural input components (see Materials and methods; [de Gee et al., 2014]). Gray-shaded interval, decision interval (between cue, i.e., decision onset, and button press). The three beta weights are the best fitting parameter estimates for the subject from panel B. IRF, impulse response function. (B) TPR time course from example subject, aligned to cue (left) and button press (right). Gray line, mean TPR (n = 624 trials). Black line, model prediction. The model provided a good fit of the shape of the TPR time course in most subjects. (C) Mean beta weights for all temporal components. As observed previously (de Gee et al., 2014), the predominant input (i.e., largest beta-weight) was a sustained component that spanned the interval between cue- and choice-components. Data points, individual subjects; ***p<0.001. (D) Correlation between TPR and reaction time (RT) (5 bins). Shading or error bars, s.e.m. All panels: Group average (N = 14); stats, permutation test.