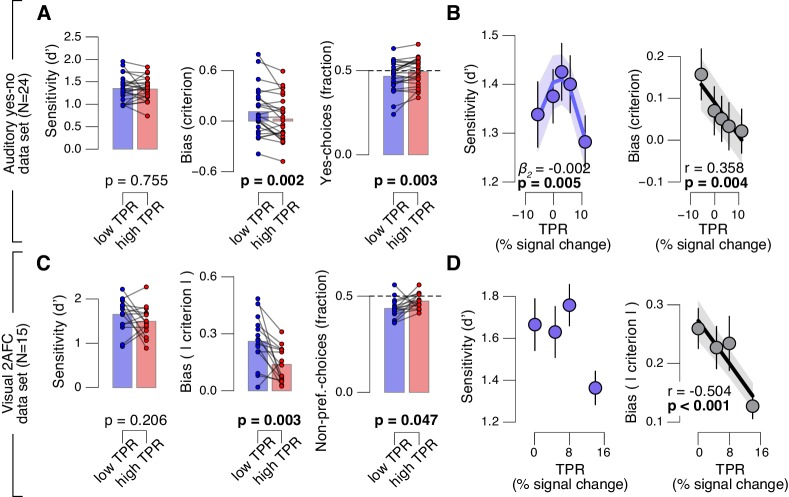
Figure 3. Arousal-linked bias reduction generalizes to other choice tasks.
(A) Perceptual sensitivity (d’; left) and decision bias, measured as criterion (middle) or fraction of ‘yes’-choices (computed as for Figure 2A, right), for low and high TPR. Data points, individual subjects. (B) Relationship between TPR and d’ or criterion (5 bins). Linear fits were plotted wherever the first-order fit was superior to the constant fit (see Materials and methods). Quadratic fits were plotted wherever the second-order fit was superior to first-order fit. (C) Perceptual sensitivity (d’, left) and decision bias, measured as absolute criterion (middle) or fraction of non-preferred choices (right), for low and high TPR. For the fraction of non-preferred choices analysis, we ensured that each TPR bin consisted of an equal number of motion up and down trials (see Materials and methods). (D) Relationship between TPR and d’ or absolute criterion (4 bins instead of 5, because of fewer trials per subject, see Materials and methods). All panels: group average (N = 24 and N = 15); shading or error bars, s.e.m.; stats, permutation test.
DOI: http://dx.doi.org/10.7554/eLife.23232.010

