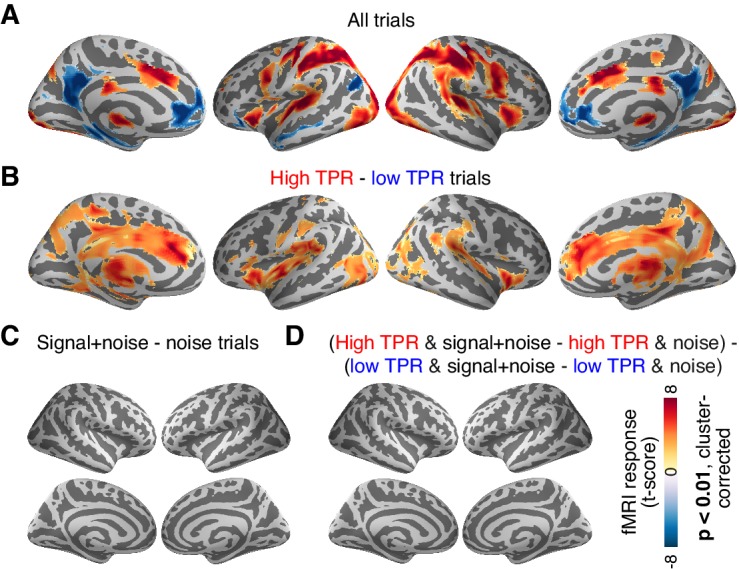
Figure 6. Cortex-wide fMRI correlates of phasic arousal and stimulus.

(A) Functional map of task-evoked fMRI responses computed as the mean across all trials. (B) As panel A, but for the contrast high vs. low TPR trials. (C) As panel A, but for the contrast signal+noise vs. noise. (D) As panel A, but for the interaction between TPR (2 levels) and stimulus (2 levels). All panels: functional maps are expressed as t-scores computed at the group level (N = 14) and presented with cluster-corrected statistical threshold (see Materials and methods).
