. 2017 Apr 11;6:e23232. doi: 10.7554/eLife.23232

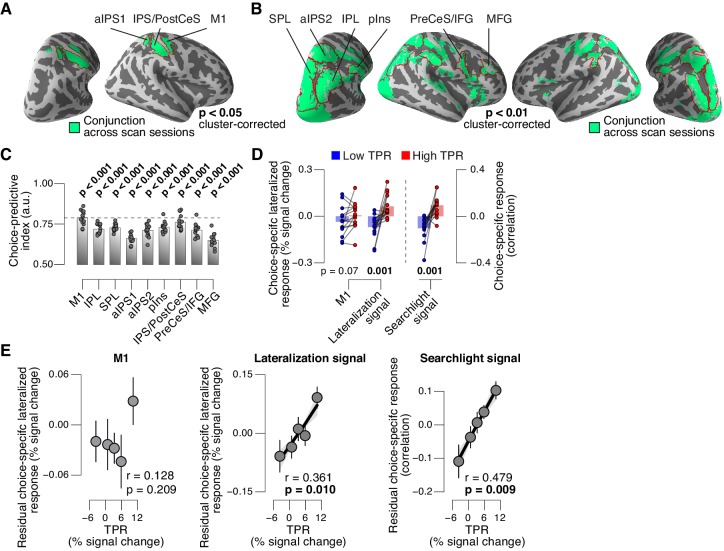
Figure 7. Phasic arousal predicts change of cortical decision signals.

(A) Conjunction of session-wise maps of logistic regression coefficients of choice against fMRI lateralization (see Figure 7—figure supplement 1A for individual sessions). Tested against 0.5 at group level; red outlines, ROIs used for further analyses. (B) Conjunction of session-wise maps of searchlight choice classification precision scores (see Figure 7—figure supplement 1C for individual sessions). Tested against 0.5 at group level; red outlines, ROIs used for further analyses. (C) Choice-predictive indexes for choice-specific responses (‘yes’ vs. ‘no’, irrespective of stimulus; see Materials and methods and Figure 7—figure supplement 1G). Dashed line, index for M1, which can be regarded as a reference given the measurement noise. Data points, individual subjects. (D) Choice-specific responses, obtained through mapping lateralization (M1 and the combined ‘lateralization signal’, i.e., regions from Figure 7A excluding M1; see Materials and methods) and through searchlight classification (combined ‘searchlight signal’, i.e., all regions from Figure 7B), for low and high TPR trials. Data points, individual subjects. (E) Correlation between TPR and M1 (left), or the combined ‘lateralization signal’ (middle), or the combined ‘searchlight signal’ (right) (5 bins). In all cases, the effect of the physical stimulus was removed (see Materials and methods). Shading or error bars, s.e.m. All panels: group average (N = 14); stats, permutation test.

DOI: http://dx.doi.org/10.7554/eLife.23232.022

Figure 7.

Figure 7—figure supplement 1. Identifying choice-specific cortical signals.
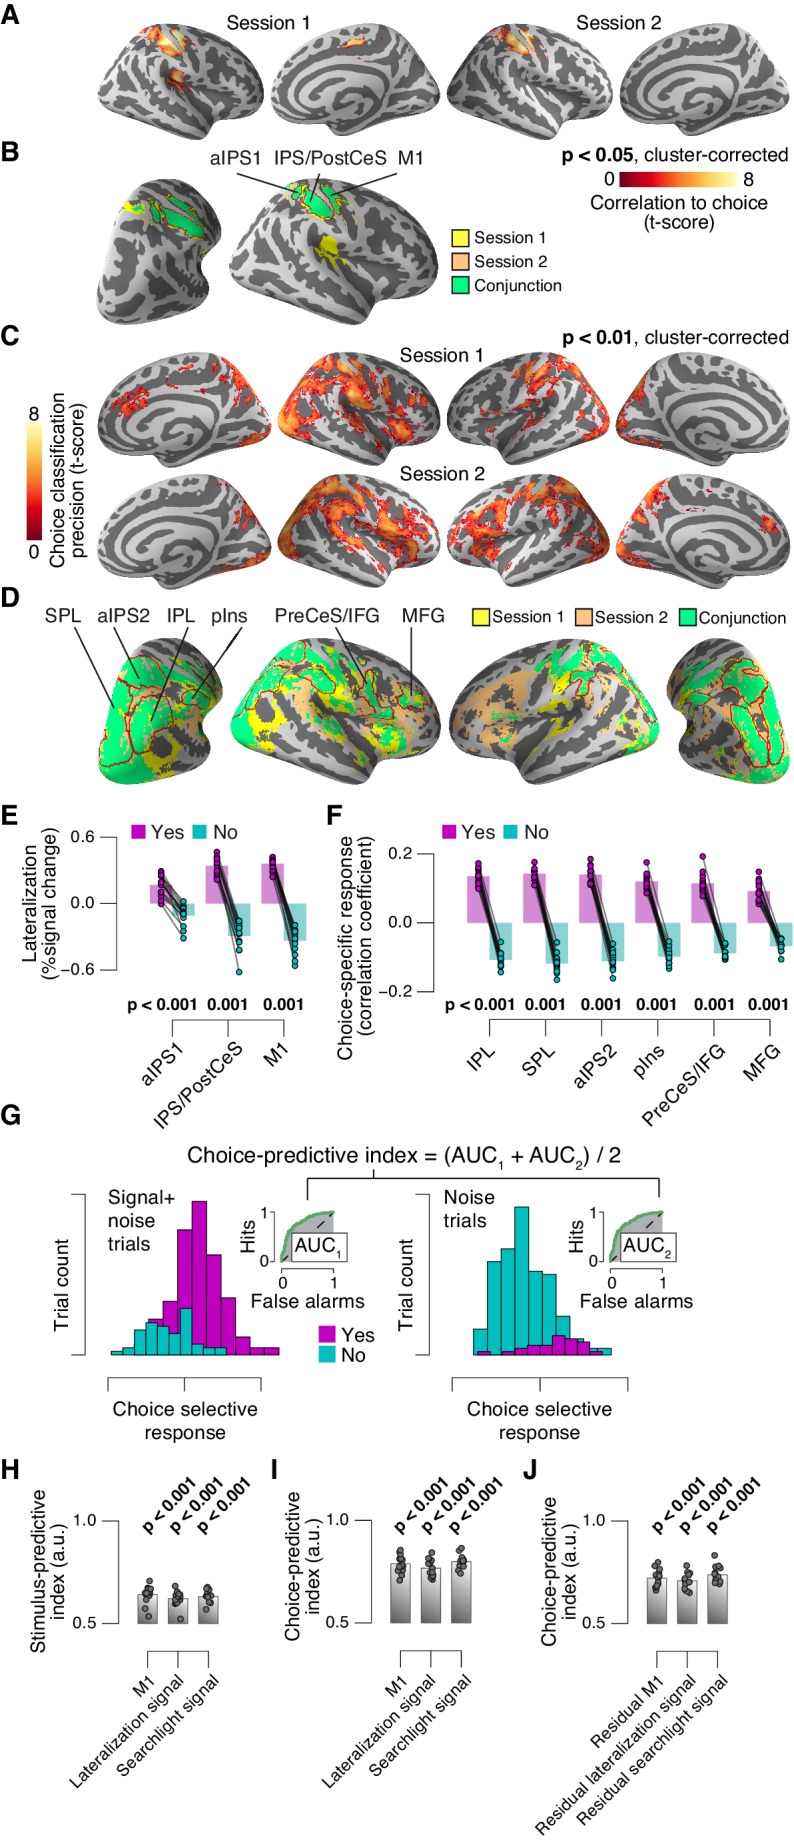
Figure 7—figure supplement 1.

(A) Session-wise maps map of logistic regression coefficients (choice against fMRI lateralization). (B) Overlay of both maps from panel A, to identify robust and replicable choice-specific responses. (C) Session-wise maps of searchlight choice classification precision scores. (D) Overlay of both maps from panel C, to identify robust and replicable choice-specific responses. A-D: all tested against 0.5 at group level; red outlines, ROIs used for further analyses. (E,F) Choice-specific responses in ROIs from panels B and D, respectively, separately for ‘yes’- and ‘no’-choices. (G) Quantifying the reliability of choice-specific cortical responses, using single-trial, lateralized M1-responses of an example subject. As Figure 5—figure supplement 1A, but now for prediction of choice, rather than of signal presence. To remove effects of signal presence, we averaged ROC indexes for choice computed separately for signal+noise and noise conditions. The resulting measure is analogous to ‘choice probability’ employed in monkey electrophysiology. The predictive index in this example was 0.82. All panels: group average (N = 14); data points, individual subjects; stats, permutation test. aIPS, anterior intraparietal sulcus; IPS, intraparietal sulcus; PostCeS, postcentral sulcus; M1, primary sensorimotor cortex (hand area); SPL, superior parietal lobule; IPL, inferior parietal lobule; pINS, posterior insular cortex; PreCeS, precentral sulcus; IFG, inferior frontal gyrus; MFG, medial frontal gyrus. (H) Stimulus-predictive indexes for choice-specific responses (‘yes’ vs. ‘no’, without first taking out effects of stimulus as in panel G). ‘Combined lateralization’ signal, weighted sum of choice-specific responses across ROIs obtained through mapping significant lateralization with respect to the hand movement (except M1; from Figure 7A; see Materials and methods). ‘Combined searchlight’ signal, weighted sum of choice-specific responses across ROIs obtained through searchlight classification (from Figure 7B). (I) As panel H, but for choice-predictive indexes (signal+noise vs. noise, without first taking out effects of choice as in Figure 5—figure supplement 1A). (J) As panel I, but after removing effects of physical stimulus via linear regression (see Materials and methods). All panels: group average (N = 14); data points, individual subjects; ***p<0.001; stats, permutation test.