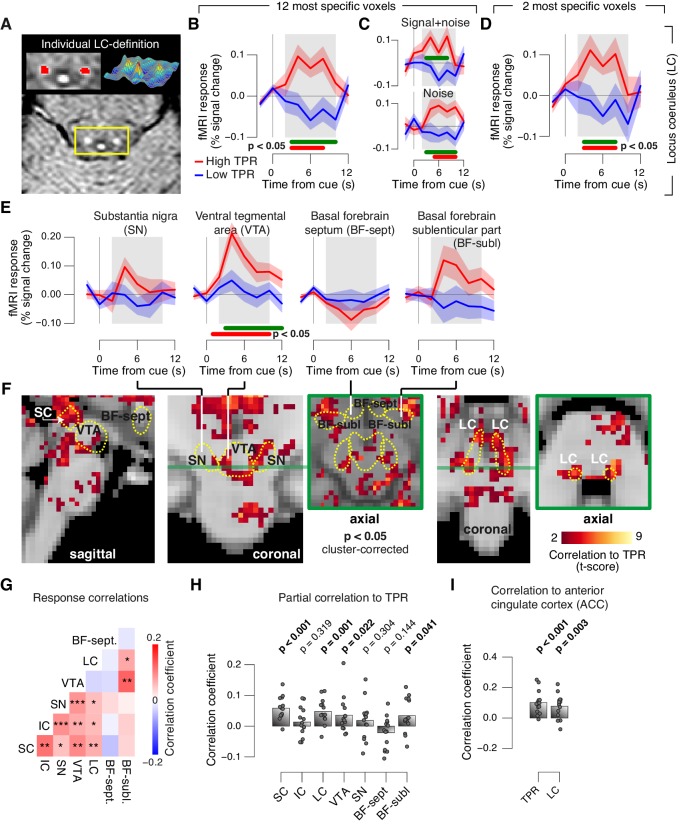
Figure 8. Pupil responses reflect responses of a network of brainstem nuclei.
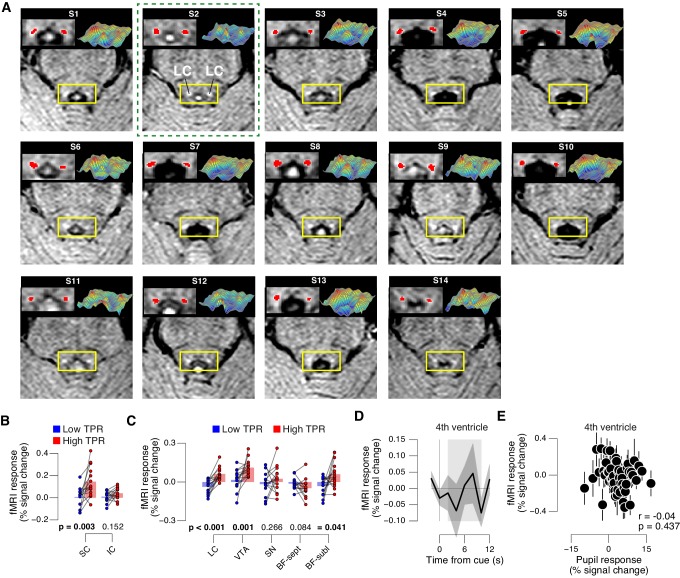
(A) Delineation of LC by structural scan. The LC corresponds to two hyper-intense spots; example subject (see Figure 8—figure supplement 1 for all subjects). Left inset, magnification of yellow box with LC ROI. Right inset, three-dimensional representation of signal intensity levels in yellow box. (B) Task-evoked LC responses for low and high TPR. Red bar, high TPR time course significantly different from zero; green bar, high TPR time course significantly different from low TPR time course (p<0.05; cluster-corrected). Grey box, time window for computing scalar response amplitudes. (C) As panel B, but split by signal+noise and noise trials. (D) As panel B, but for the 2 voxels with highest probability of containing the LC. (E) As panel B, but for SN, VTA, and two BF-ROIs. (F) Map of single-trial correlation between TPR and evoked fMRI responses (tested against 0 at group level). Yellow outlines, brainstem nuclei from probabilistic atlases. (G) Matrix of correlations between evoked brainstem fMRI responses. Stats corrected with false discovery rate (FDR). (H) Partial correlation of evoked fMRI responses and TPR. For each ROI, responses of all other ROIs were first removed via linear regression. (I) Correlation between fMRI responses in ACC and TPR and LC. All panels: group average (N = 14); shading, s.e.m.; data points, individual subjects; stats, permutation test.


