. 2017 Mar 20;6:e22962. doi: 10.7554/eLife.22962

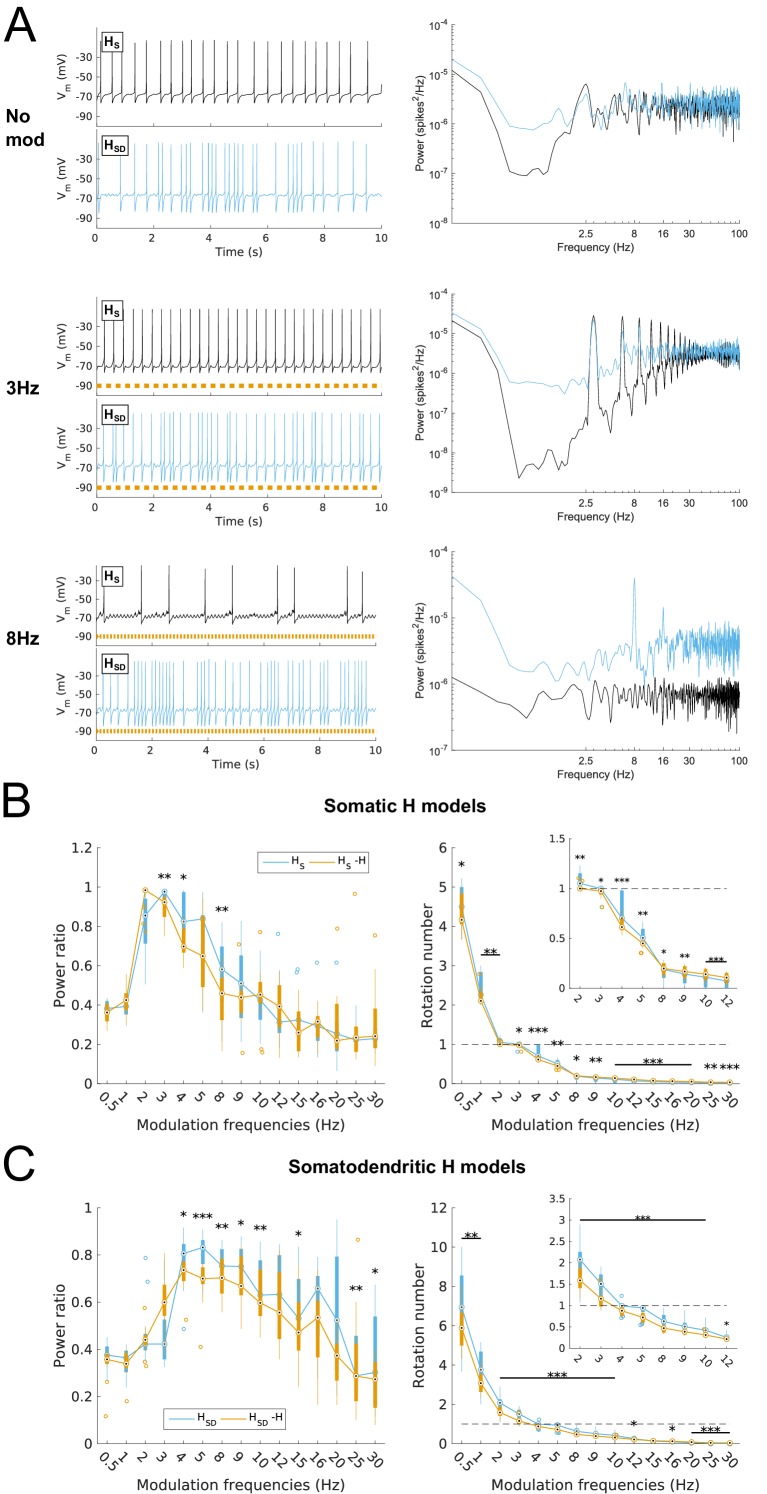
Figure 2. Effects of dendritic H distribution and H block on recruitment of O-LM model spiking in response to modulated somatodendritic inhibitory input.

(A) Somatic Vm traces for example somatic H model (HS, black) and somatodendritic H model (HSD, blue) under various modulation conditions (top – no modulation; middle – 3 Hz modulation; bottom – 8 Hz modulation). With modulated inputs, orange bars at bottom denote phase of peak modulation at the specified frequency (see Materials and methods). Power spectrum density (PSD) plots shown to the right of each output trace. (B, C) Power ratios (left) and rotation numbers (right) under different modulation frequencies for models with somatic H (B) and somatodendritic H (C) in control and H blocked (‘-H’) conditions. Insets in rotation number plots show zoomed portion in the theta range (2–12 Hz). Statistical test used was repeated measures ANOVA for the populations of HS and HSD models between all modulation frequencies crossed with H block condition (power ratios HS: F(1,15) = 2.23, p=0.013, n = 16; HSD: F(1,15) = 2.89, p=0.017, n = 16; rotation numbers HS: F(1,15) = 27.94, p<0.001, n = 16; HSD: F(1,15) = 10.35, p=0.006, n = 16; Huynd-Feldt correction reported for all tests). Boxplot annotations as per Figure 1G legend.

DOI: http://dx.doi.org/10.7554/eLife.22962.009

Figure 2.

Figure 2—figure supplement 1. Effect of blocking H on sub- and suprathreshold measures.

Figure 2—figure supplement 1.

Somatic Vm means (A), fluctuations, expressed as standard deviation (B), and firing rates (C) without modulation and in control, H block (‘-H, pre exc’), and adjusting for H block by increased excitatory peak conductance (‘-H’). (D) Somatic Vm trace of a sample model in control (black) as well as H block with increased excitatory conductance (red). Statistical test throughout was 2-sample t-test, with p<0.05 (*), p<0.001 (***), and n.s. denoting not significant. n = 16 for each HS and HSD population.
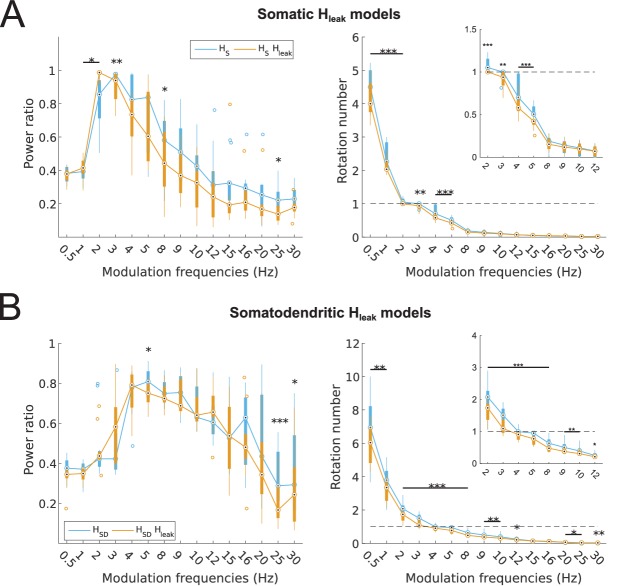
Figure 2—figure supplement 2. Partitioning of spiking responses of O-LM models into high and low theta when using ‘H leak’ instead of H block.

Figure 2—figure supplement 2.

(A, B) Power ratios (left) and rotation numbers (right) under different modulation frequencies for models with somatic H (A) and somatodendritic H (B) in control and H leak (‘H leak’) conditions. Insets in rotation number plots show zoomed portion in the theta range (2–12 Hz). Statistical test used was repeated measures ANOVA for the populations of HS and HSD models between all modulation frequencies crossed with H condition (power ratios HS: F(1,15) = 2.19, p=0.01, n = 16; HSD: F(1,15) = 3.87, p=0.001, n = 16; rotation numbers HS: F(1,15) = 46.64, p<0.001, n = 16; HSD: F(1,15) = 10.76, p=0.007, n = 16; Huynd-Feldt correction reported for all tests). Boxplot annotations as per Figure 1G legend.