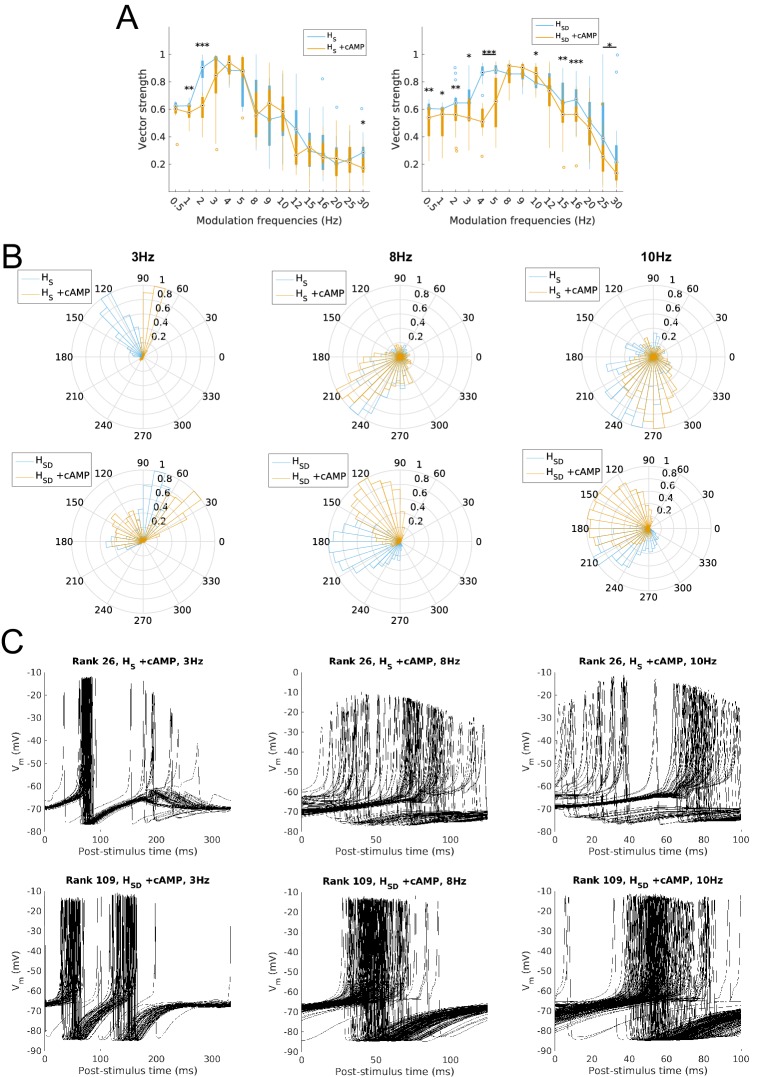
Figure 8. Firing precision and phase of models with cAMP modulation of H channels.
(A) Vector strength across models with somatic H (HS, left) and somatodendritic H (HSD, right), in control (blue) and with cAMP (orange) conditions, across all modulation frequencies. Statistical test used was two-way repeated measures ANOVA test for the populations of HS and HSD models between all modulation frequencies crossed with H blocked condition (HS: F(1,15) = 4.20, p=0.003, n = 16; HSD: F(1,15) = 6.38, p<0.001, n = 16; Huynd-Feldt correction reported for both tests). Boxplot annotations as per Figure 1G legend. (B) Firing phase histograms for models under cAMP condition with somatic H (top) and somatodendritic H (bottom), for control (blue) and cAMP (orange) conditions, and modulation frequencies of 3 Hz (left), 8 Hz (middle), and 10 Hz (right). (C) Overlay of Vm traces of all spikes for an example somatic H model with cAMP (top row) and somatodendritic H model with cAMP (bottom row), cut and aligned with respect to time of release from inhibition at 3 Hz (left), 8 Hz (middle), and 10 Hz (right).

