
Figure 2.
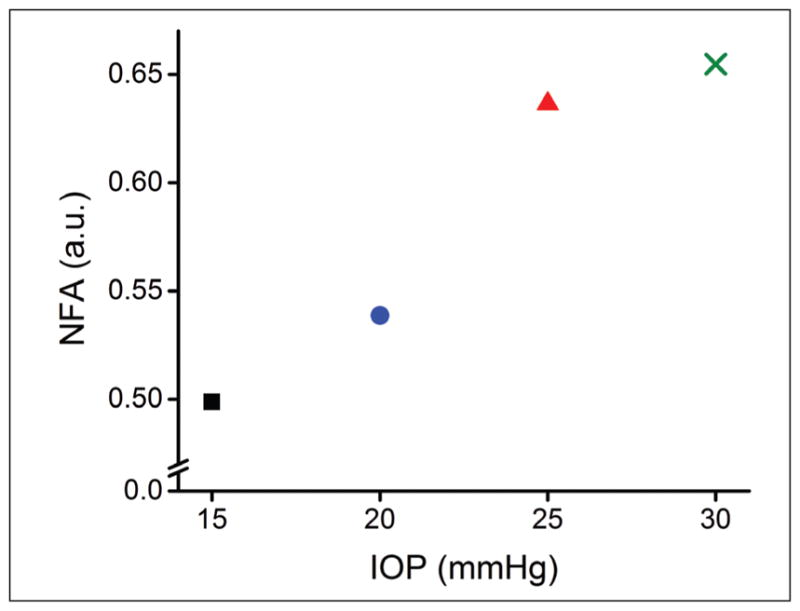
Normalized fractional anisotropy (NFA) as quantified by Equation 2 as a function of intraocular pressure (IOP). The red square, blue circle, red triangle, and green cross represent data from 15, 20, 25, and 30 mm Hg, respectively.
Official websites use .gov
A
.gov website belongs to an official
government organization in the United States.
Secure .gov websites use HTTPS
A lock (
) or https:// means you've safely
connected to the .gov website. Share sensitive
information only on official, secure websites.
Normalized fractional anisotropy (NFA) as quantified by Equation 2 as a function of intraocular pressure (IOP). The red square, blue circle, red triangle, and green cross represent data from 15, 20, 25, and 30 mm Hg, respectively.