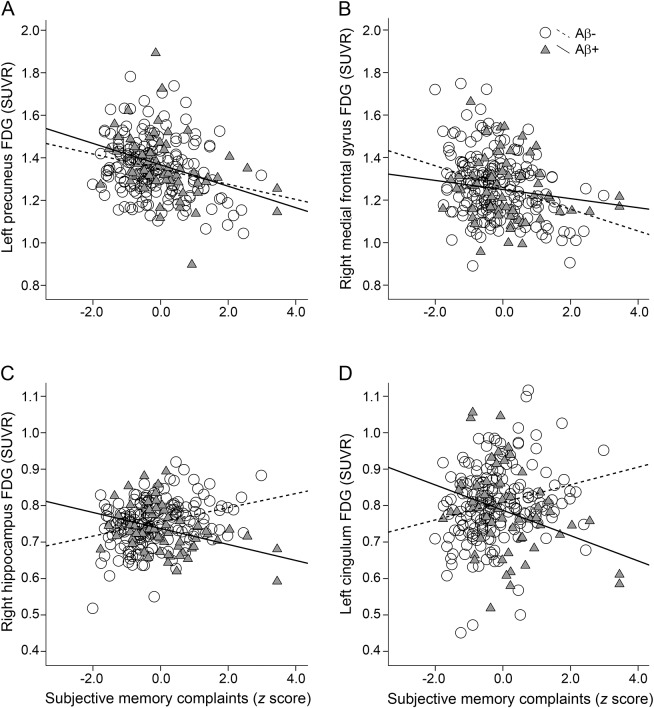
Figure 2. FDG metabolism plots.
Extracted FDG metabolism in (A) left precuneus and (B) right middle frontal gyrus (see white circles from figure 1A) showing the main effect of SMCs. In these regions, decreased glucose metabolism relates to increased SMCs regardless of amyloid status. Extracted FDG metabolism in (C) right hippocampus and (D) left mid cingulum (see green circles in figure 1B) demonstrating the SMCs by amyloid interaction. In Aβ+ individuals (triangles/solid line), having more complaints is related to decreased glucose metabolism. Aβ = β-amyloid; FDG = fluorodeoxyglucose; SMC = subjective memory complaint; SUVR = standardized uptake volume ratio.

