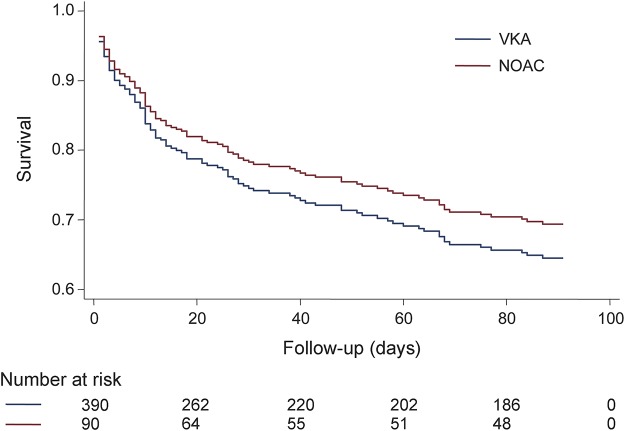
Figure 2. Survival curve comparing non–vitamin K oral antagonist anticoagulant (NOAC)–associated intracerebral hemorrhage (ICH) and vitamin K antagonist anticoagulant (VKA)–associated ICH 90-day mortality.
Adjusted for age; sex; baseline Glasgow Coma Scale score, ICH location, and log volume; intraventricular hemorrhage volume; and intracranial surgery.

