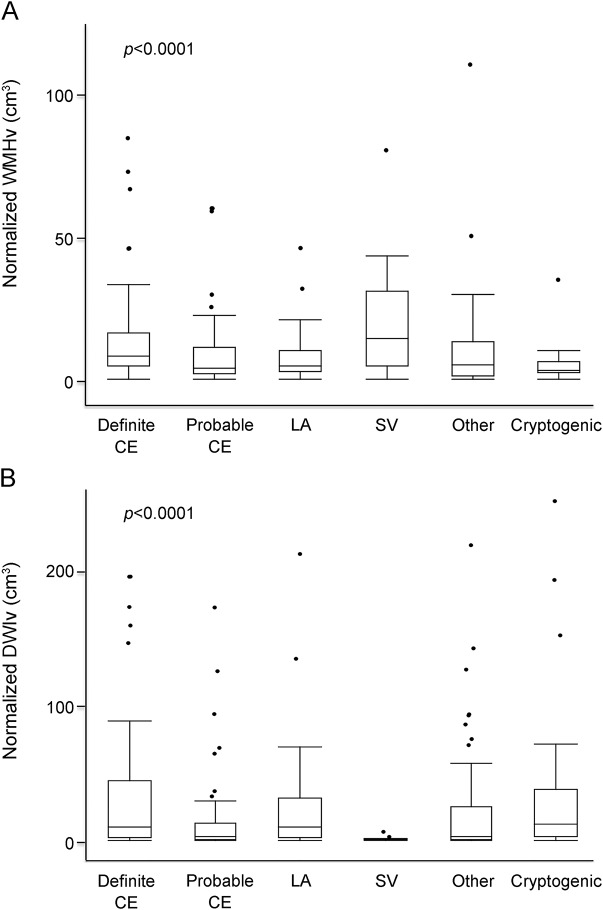
Figure 2. WMH and infarct volume as a function of stroke subtype.
Box plots of normalized WMHv (A) and normalized DWIv (B) as a function of TOAST subtype. Plots include outliers for each subtype depicted as solid circles. CE = cardioembolic; DWI = diffusion-weighted imaging; DWIv = diffusion-weighted imaging volume; LA = large artery; SV = small vessel; TOAST = Trial of Org 10172 in Acute Stroke Treatment; WMH = white matter hyperintensity; WMHv = white matter hyperintensity volume.

