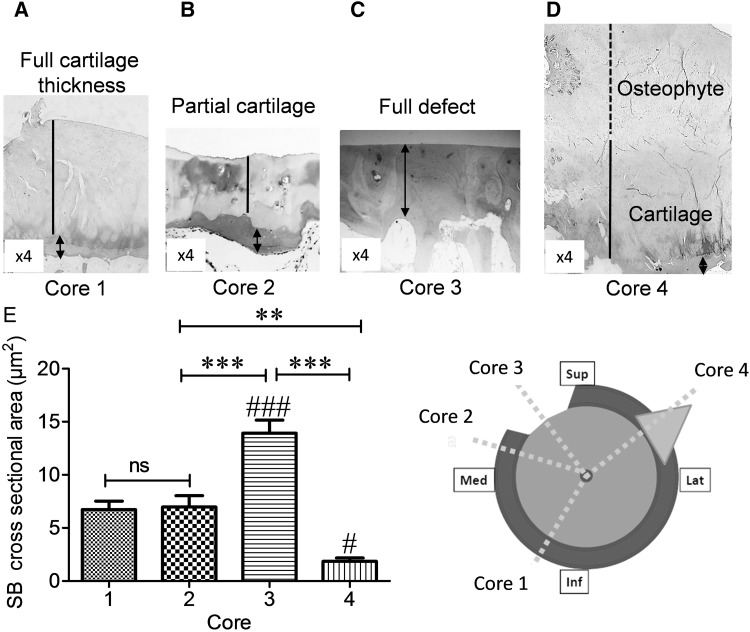
Fig. 1.
Subchondral bone thickness varies in OA femoral head. Cylindrical cores were taken from 4 OA femoral head biopsies. Insert cartoon represents the proposed taken sections of femoral head. Core 1 macroscopically normal cartilage, Core 2 partial cartilage defect, Core 3 full cartilage defect, Core 4 osteophyte. Representative images of H&E staining from a macroscopically normal cartilage, b partial cartilage defect, c full cartilage defect, and d osteophyte. e Cross-sectional areas of subchondral bone thickness measured by ImageJ software (µm2). Data are presented as mean ± SEM (One-way analysis of variance, Tukey’s multiple comparison test) from six slides per each core from four femoral head biopsies. (# P < 0.05 and ### P < 0.001 for comparison of subchondral bone between full cartilage defect in cores 3 and osteophytes in cores 4 with macroscopically normal cartilage in cores 1, **P < 0.01, and ***P < 0.001 for comparison of core 3 to other cores). Magnifications in a–d (×4), dashed line osteophyte, solid line cartilage and arrowheads indicate subchondral bone. Not significant (ns), superior (Sup), inferior (Inf), median (Mid), and lateral (Lat)

