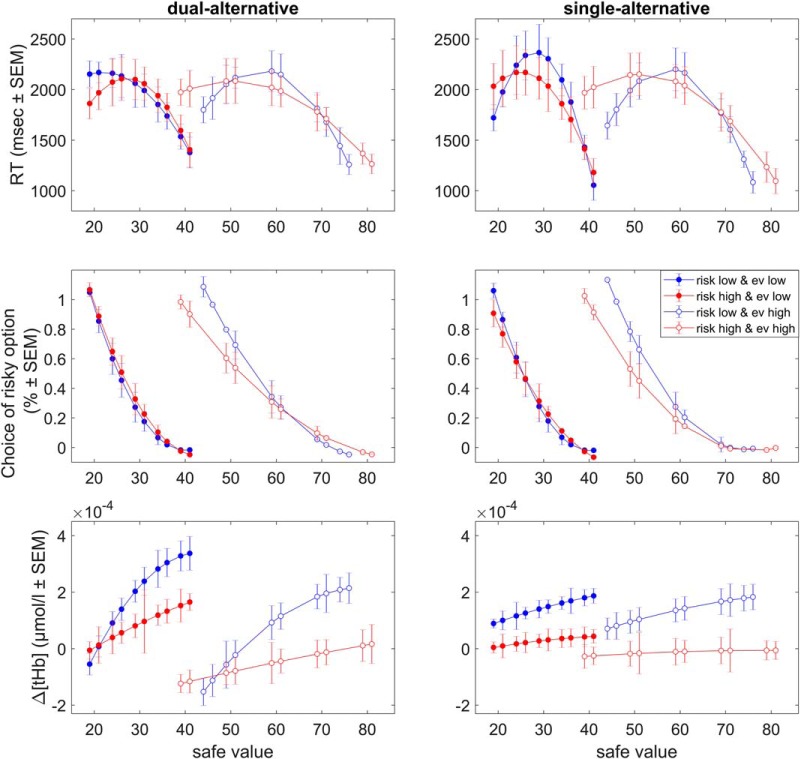
Figure 3.
Behavior and basic neural responses in Study 1. Top: RT slopes. Plots illustrate the effects of risk context and working memory load on RT, separately for the dual- and single-alternative experiments. (Middle) Choice slopes. Plots illustrate the effects of context and working memory load on choices of risky options, separately for the dual- and single-alternative experiments. Bottom: Δ[tHb] slopes. Plots illustrate the context- and experiment-dependence of Δ[tHb] response slopes averaged over all channels, separately for the dual- and single-alternative experiments. Slopes are shown for the peak response (time interval 4–7 s after alternatives onset). Note that all slopes are shown in terms of the coefficients for the second polynomial that best fitted the data (in a least-squares sense). Error bars represent SEM. See Table 1 for statistics.

