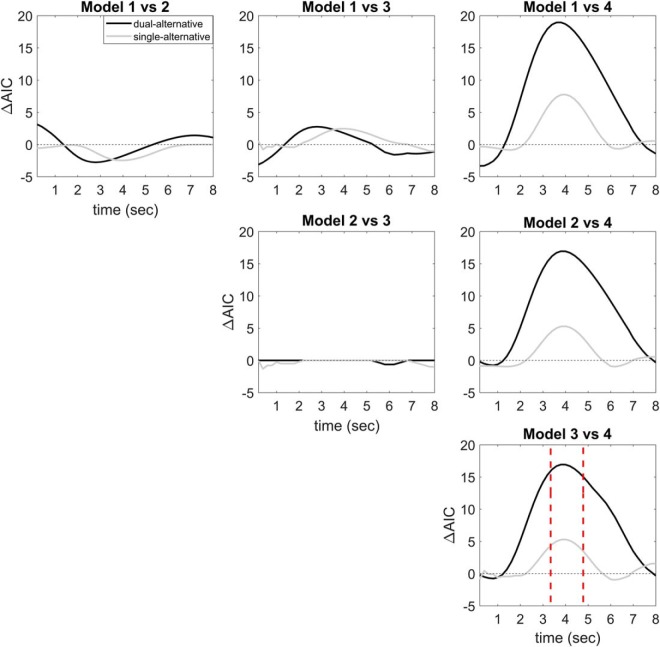
Figure 5.
Model comparison. Plots illustrating the time-resolved AIC-differences (ΔAIC) averaged over all channels between models 1–4, separately for the two experiments. Positive values correspond to a relatively better fit of the last-named model. Model 4 (full divisive normalization model) showed a relatively better fit compared with the other models, i.e., the difference model (model 1), the basic divisive normalization model (model 2), and the enhanced divisive normalization model (model 3). Moreover, model 4 provided a better overall fit around the canonical hemodynamic response peak (4 s) in the dual- compared with the single-alternative experiment.

