Fig. 2.

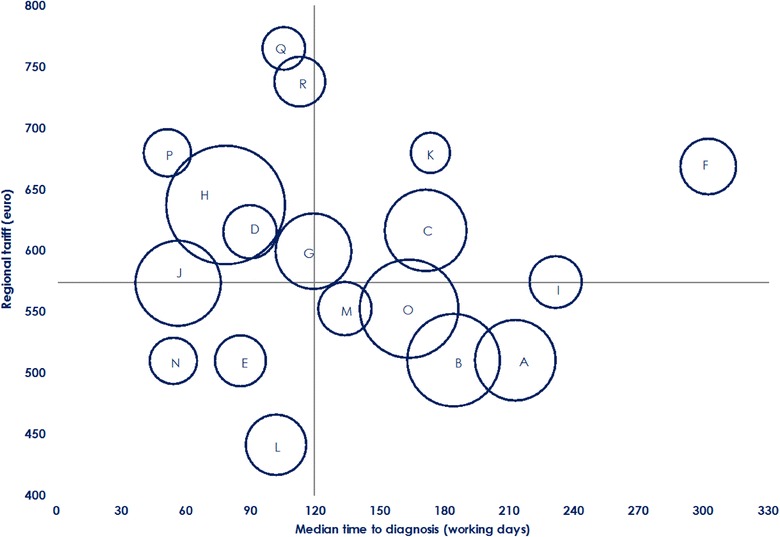
Median time to diagnosis (working days) and diagnostic costs (€): Intercenter variability. Bubbles’ size represents the number of diagnoses per center

Median time to diagnosis (working days) and diagnostic costs (€): Intercenter variability. Bubbles’ size represents the number of diagnoses per center