
Fig. 2.
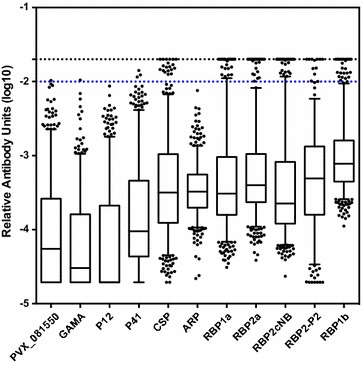
IgG levels to 11 Plasmodium vivax proteins in Thai volunteers. Relative antibody units, as compared to the immune control plasma pool, for each protein were calculated for everyone (n = 315–546). Box plots represent the median and interquartile range of log10-transformed data, error bars show the 5–95 percentile and filled circles show outlier values. The 1/50 and 1/100 values of the immune control plasma pool are shown in black and blue lines, respectively