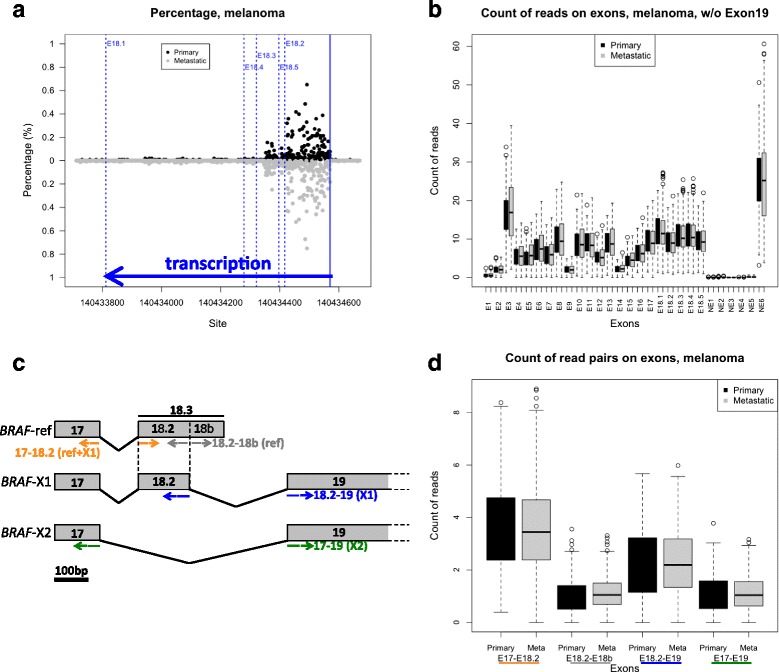
Fig. 1.

Expression of BRAF transcript variants in melanoma. a Analysis of the length of BRAF 3’UTR by counting the reads mapped to E18.1,2,3,4, and 5. b Count of the reads mapped to all BRAF exons, except E19. c Cartoon depicting the strategy used to measure the relative expression levels of BRAF-ref, BRAF-X1, and BRAF-X2. Paired reads spanning: exon 17 and exon 18.2 were counted as a measure of the cumulative levels of BRAF-ref and BRAF-X1 (yellow); exon 18.2 and exon 18b were counted as a measure of BRAF-ref levels (grey); exon 18.2 and exon 19 were counted as a measure of BRAF-X1 levels (blue); and exon 17 and exon 19 were counted as measure of BRAF-X2 (green). d Box plot of the reads that span E17-E18.2, E18.2-E18b, E18.2-E19, and E17-E19 in primary (black boxes) and metastatic (grey boxes) melanoma samples
