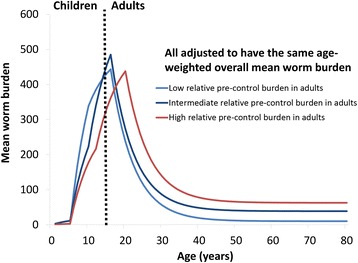
Fig. 2.

Model scenarios regarding the age-intensity profiles of infection and the relative pre-control burden in adults. To ensure the results are comparable, the R0’s were adjusted for these different profile scenarios such that they had the same pre-control mean worm burden (i.e. we ensured that we are not comparing the impact of both a different age-profile and a different initial overall burden). Model parameters are shown in Additional file 1: Tables S1 and S2
