
Fig. 6.
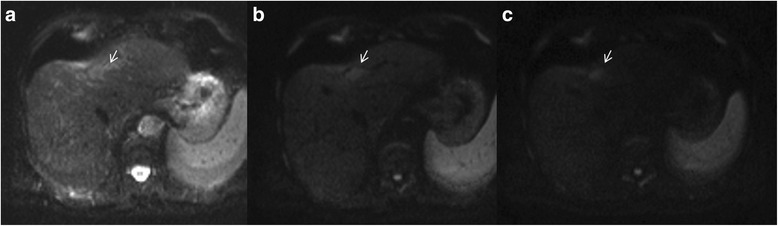
The same patient of Fig. 5. Restricted diffusion. The nodule (arrow) shows hyperintense signal on b0 s/mm2 (a), on b 500 s/mm2 (b) and on b 800 s/mm2(c)
Official websites use .gov
A
.gov website belongs to an official
government organization in the United States.
Secure .gov websites use HTTPS
A lock (
) or https:// means you've safely
connected to the .gov website. Share sensitive
information only on official, secure websites.
The same patient of Fig. 5. Restricted diffusion. The nodule (arrow) shows hyperintense signal on b0 s/mm2 (a), on b 500 s/mm2 (b) and on b 800 s/mm2(c)