
Figure 2.
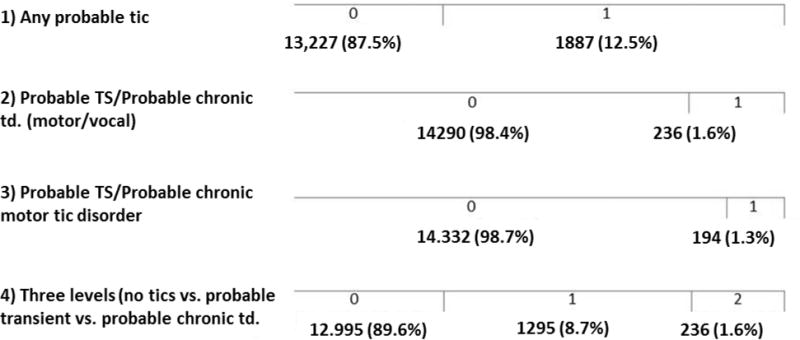
Descriptive statistics: Number of unaffected (‘0’) and affected (‘1’ and ‘2’) participants, according to each of the four phenotypes. The fourth phenotype has two thresholds and is a combination of the first and second dichotomous phenotype.