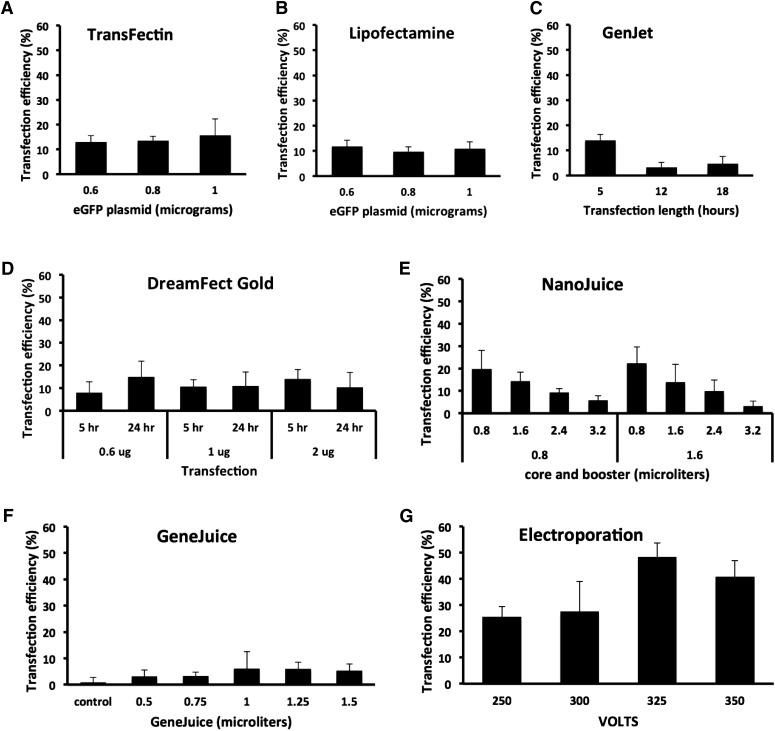
FIGURE 1.
Transfection efficiencies by different reagents in MEF cells. Transfection efficiency was calculated as described in Materials and Methods and represented as histograms. (A and B) For TransFectin and Lipofectamine, different amounts of DNA plasmid (0.6, 0.8, and 1 μg) were combined with 2 μl reagent. Bars represent the means ± sd of 6 cell field photographs at 44 h. Student's t test showed not significant differences. For TransFectin, 0.6 vs. 0.8 μg (P = 0.6), 0.6 vs. 1 μg (P = 0.4), and 0.8 vs. 1 μg (P = 0.5). For Lipofectamine, 0.6 vs. 0.8 μg (P = 0.1), 0.6 vs. 1 μg (P = 0.5), and 0.8 vs. 1 μg (P = 0.5). Average number of cells counted per histogram bar is 674 for TransFectin and 461 for Lipofectamine. (C) For GenJet, different times of incubation of the transfection reagent were tested (5, 12, and 18 h). Bars represent the means ± sd of 6 cell field photographs at 44 h. Student’s t test: 5 vs. 12 h (P = 0.0007), 5 vs. 18 h (P = 0.001), and 12 vs. 18 h (P = 0.4). Average number of cells counted per histogram bar is 671. (D) For DreamFect Gold, different amounts of DNA plasmid (0.6, 0.8, and 1 μg) and different times of transfection incubation time (5 and 24 h) were tested. Bars represent the means ± sd of 6 cell field photographs at 44 h. Student’s t test: at 5 h, 0.6 vs. 2 μg (P = 0.04). No other statistically significant differences were found. Average number of cells counted per histogram bar is 432. (E) For NanoJuice, we combined various amounts of NanoJuice Core Transfection (0.8 and 1.6 μl) and NanoJuice Transfection Booster (0.8, 1.6, 2.4, and 3.2 μl). Bars represent the means ± sd of 4 cell field photographs at 21 h. Student’s t test: 0.8/0.8 vs. 0.8/3.2 (P = 0.02), 0.8/1.6 vs. 0.8/3.2 (P = 0.01), 1.6/0.8 vs. 0.8/2.4 (P = 0.03), and 1.6/0.8 vs. 0.8/3.2 (P = 0.003). Average number of cells counted per histogram bar is 180. (F) For GeneJuice, we tested DNA plasmid amount (0.5, 0.75, 1, 1.25, and 1.5 μg) in combination with 0.75 μl transfection reagent. Bars represent the means ± sd of 4 cell field photographs at 21 h. Student’s t test: control vs. 1.25 (P = 0.02) and control vs. 1.5 (P = 0.04). Average number of cells counted per histogram bar is 161. (G) For electroporation, 4 different pulse magnitudes (250, 300, 325, and 350 V) were tested. Bars represent the means ± sd of 4 cell field photographs at 21 h. Student’s t test: 250 vs. 325 V (P = 0.0006), 250 vs. 350 V (P = 0.006), and 300 vs. 325 V (P = 0.02). Average number of cells counted per histogram bar is 72.

