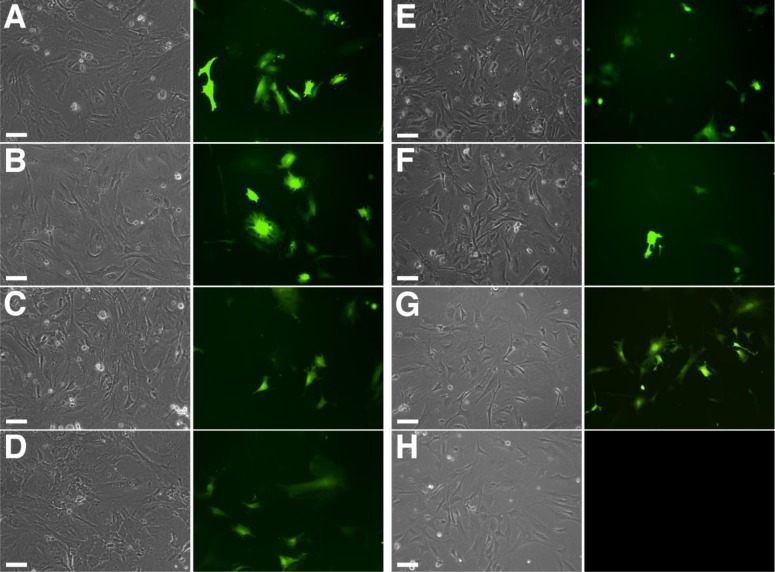
FIGURE 3.
EGFP fluorescence in transfected MEF cells, which were examined 22 h after transfection of an EGFP-expressing plasmid construct by fluorescence microscopy. Panels show bright-field (grayscale) and corresponding UV images (color) for each reagent. (A) TransFectin, (B) Lipofectamine, (C) GenJet, (D) DreamFect Gold, (E) NanoJuice, (F) GeneJuice, (G) Electroporation, and (H) control transfection with plasmid vector alone. Photographs were taken at 10× original magnification. Original scale bars, 100 μm.

