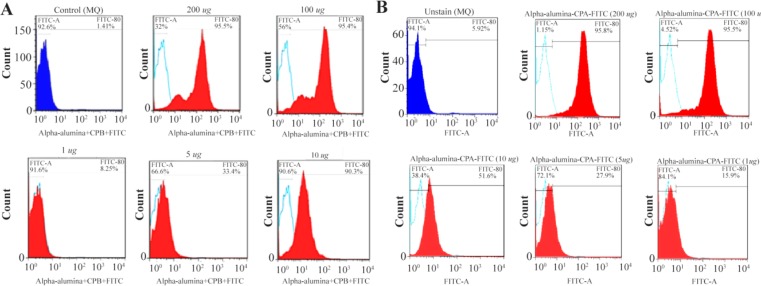
Figure 9.
Flowcytometry analysis of internalized α-alumina-CPA/CPB-FITC by murine macrophages. A) Shows that 8.2, 33.3, 90.3, 94.55 and 96.7% of macrophages received α-alumina-CPB-FITC labeled particles in the presence of 1, 5, 10, 100 and 200 μg/ml concentrations, respectively. B) Shows that 15, 27, 61, 95 and 98% of macrophages received α-alumina-CPB-FITC labeled particles in the presence of 1, 5, 10, 100 and 200 μg/ml concentrations, respectively.

