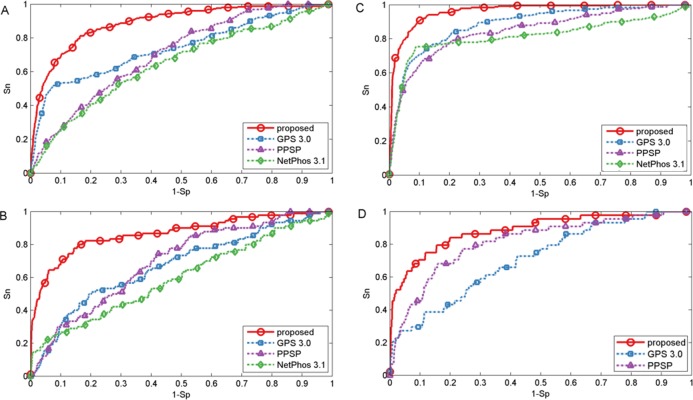
Figure 2. Performance of phosphorylation ROC curves for kinase groups CAMK, CK1, CMGC, and TKL with different methods.
The kinase groups CAMK (A) and CK1 (B) are in response to S sites, and the kinase groups CMGC (C) and TKL (D) are in response to T sites. The red, blue, purple and green lines represent the performance of the proposed method, GPS, PPSP, NetPhos, respectively.

