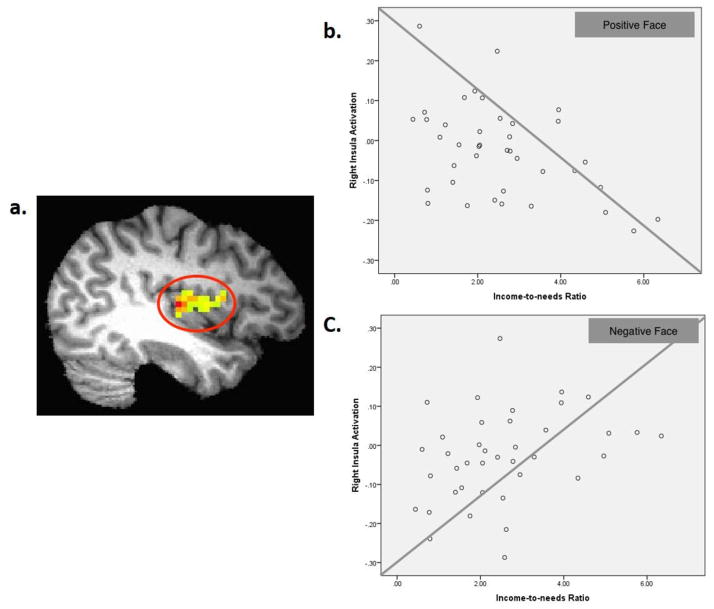
Figure 2.
(a) Right insula (BA13; x, y, z = 41, −13, 8, k=88) in a red circle showing income-toneeds ratio X condition interaction, p < 0.05, whole-brain cluster-wise corrected; (b) and (c) a scatterplot describing the negative associations between income-to-needs ratio and the neural responses to positive infant faces [r(37)=−0.45, p < 0.005] and negative infant faces [r(37)=0.33, p < 0.05].

