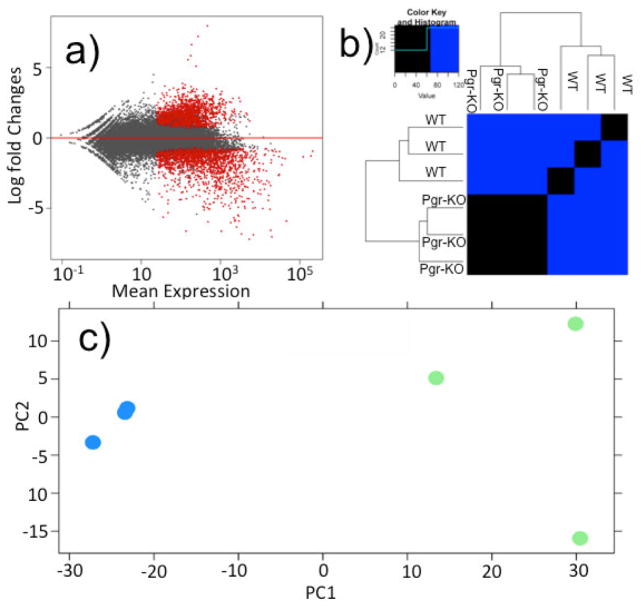
Figure 2. A large set of genes expressed differentially in preovulatory follicular cells in wildtype (WT) in comparison to those in Pgr-KO.
a) Volcano plot shows the global transcriptional changes in WT vs Pgr-KO. All genes present on the RNA-seq analysis were plotted. Each circle represents one gene. Genes with significant difference (FDR corrected p<0.05, fold change> 2) are indicated by red circles, while grey circles indicate those genes that did not show significant differences in their expression between WT and Pgr-KO. b) Heat map comparison of top 2000 differentially expressed genes ranked by FDR-corrected p-value. Each column represents an independent sample collected from follicular cells of stage IV oocytes that had completed final oocyte maturation, but prior to ovulation. c) Principal component analysis (PCA) of top 2000 significant differentially expressed genes from preovulatory follicular cells of WT and Pgr-KO. The blue circles represent transcriptomic data from three preovulatory follicular samples collected from three Pgr-KO fish, and the green circles represent the data from three samples of three WT fish.

