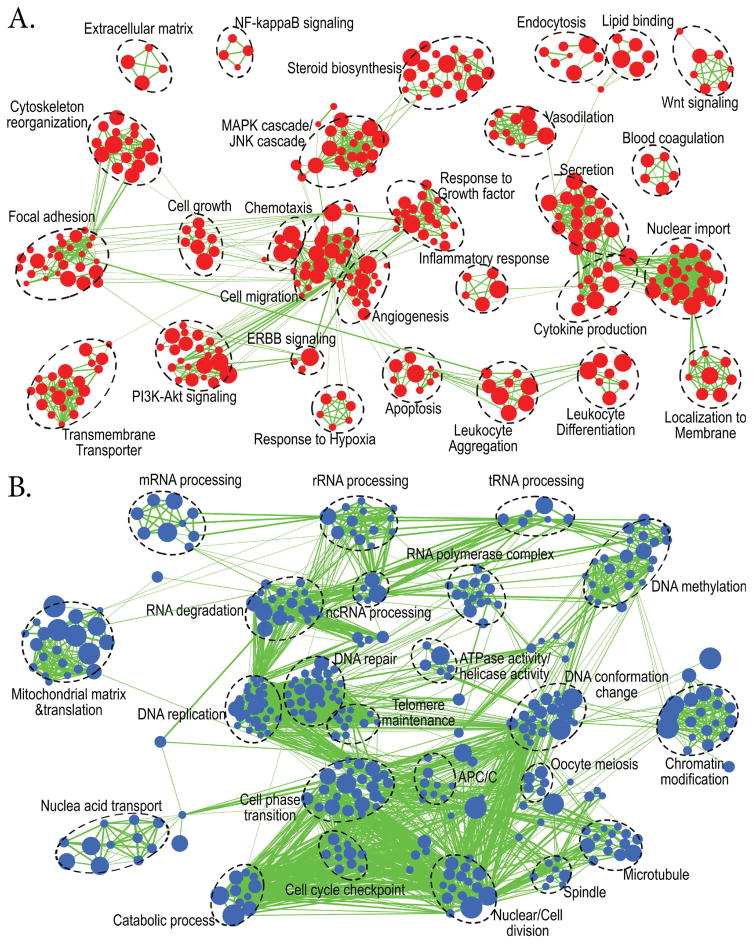
Figure 5. Enrichment map analysis showed two distinct groups of biological processes and pathways which were significantly enhanced or suppressed in wildtype (WT) compared to Pgr-KO (p<0.0005).
Nodes represent enriched gene sets, clustered automatically by the Enrichment Map plugin for Cytoscape program (Merico et al., 2010) according to the number of genes shared within sets. Node size is proportional to the total number of genes within each gene set. The proportion of shared genes among gene sets is represented by the thickness of the line between the nodes. Functionally related gene sets were manually grouped, encircled by a dashed black line, and labeled. A. Enrichment map for 1230 up-regulated genes in WT compared to Pgr-KO. B. Enrichment map for 1658 down-regulated genes in WT compared to those in Pgr-KO.

