
Fig. 6.
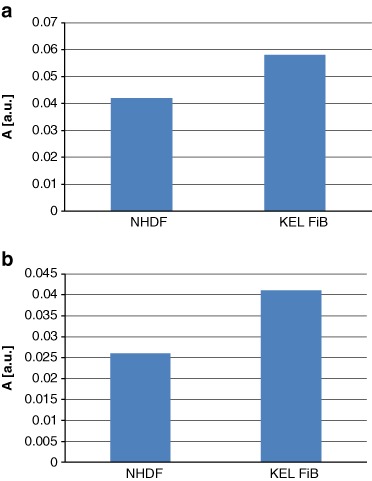
The amplitudes (A) [±0.01 a.u.] of the EPR spectra of a control cells: NHDF and KEL FiB, and b the UV irradiated control cells
Official websites use .gov
A
.gov website belongs to an official
government organization in the United States.
Secure .gov websites use HTTPS
A lock (
) or https:// means you've safely
connected to the .gov website. Share sensitive
information only on official, secure websites.
The amplitudes (A) [±0.01 a.u.] of the EPR spectra of a control cells: NHDF and KEL FiB, and b the UV irradiated control cells