
Fig. 2.
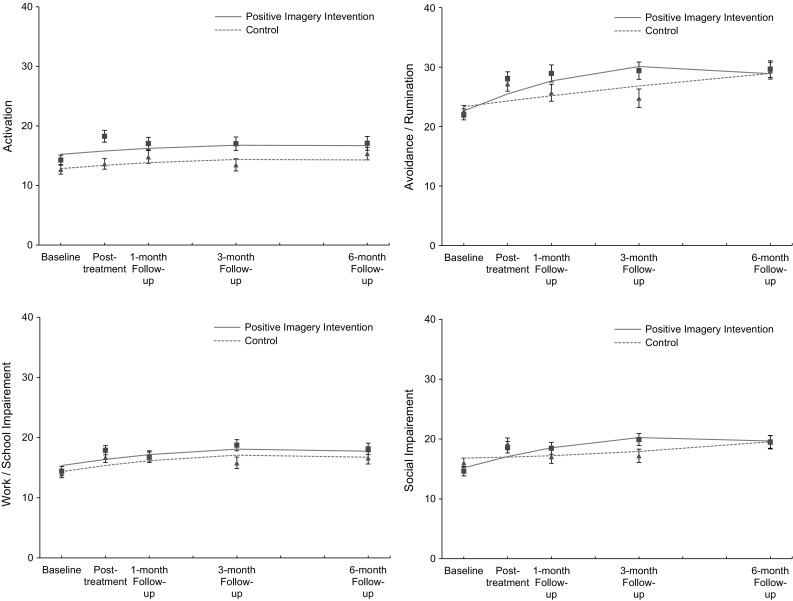
Behavioural Activation for Depression Scale (BADS) subscales over five time points for both the positive mental imagery and control conditions showing mixed regression-based estimated means (lines) and observed means (rectangles for the positive imagery intervention group and triangles for the control group) and standard errors, showing the significant advantage of the positive mental imagery condition on the Avoidance/Rumination and Social Impairment subscales