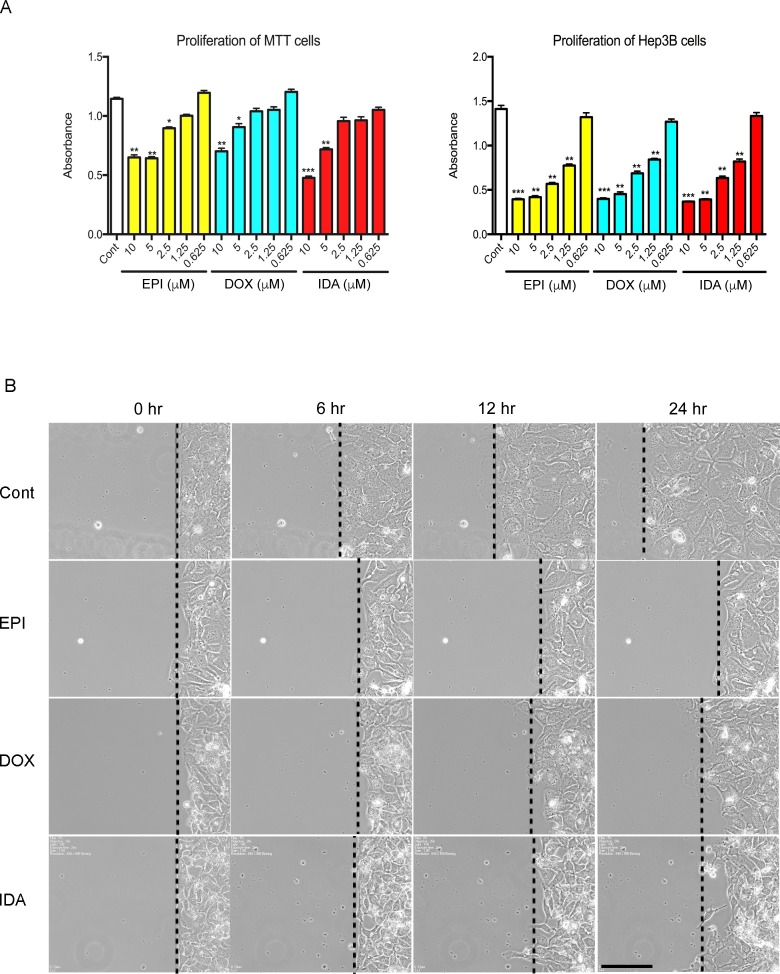
Figure 1. Effects of anthracyclines on cell proliferation and cell migration.
A. MTT or Hep3B cells were seeded in a 96-well plate. Cell proliferation was assessed under treatment of EPI, DOX, or IDA at different concentrations (10, 5, 2.5, 1.25, or 0.625 μM). Control versus anthracycline treatment, *P < 0.05; **P < 0.01; ***P < 0.001. B. Cell migration on a confluent cell monolayer was observed for 24 hours under treatment of EPI, DOX, or IDA at a concentration of 0.625 μM. DMSO was used as the control group. Bar = 100 μm.

