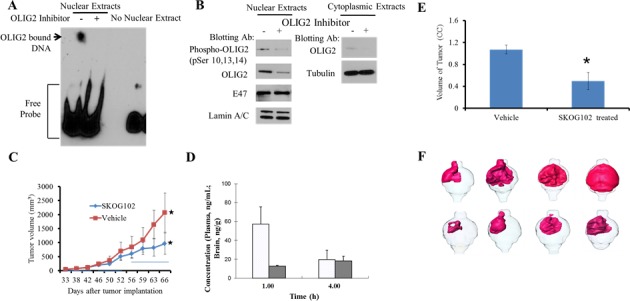
Figure 7. SKOG102 suppresses OLIG2-DNA binding, it enters the brain, and it inhibits GBM in vivo growth.

GBM8 patient-derived cells were treated with vehicle or 5 μM Olig2 inhibitor for 20 hr. A. Nuclear fractions were isolated and used for an electrophoretic mobility shift assay (EMSA). The full length blot is shown in Figure S 10 in Supplementary Materials. B. Nuclear fractions were probed for phosphorylation of OLIG2 and total OLIG2. Cytoplasmic extracts were also examined for re-localization of OLIG2 from the nucleus to the cytoplasm. OLIG2 does not re-localize to the cytoplasm after inhibitor treatment. Each panel was run under the same conditions and the full length blots are shown in Figure S 11 in Supplementary Materials. C. Flank tumor study. GBM4 cells were implanted subcutaneously into NSG mice, dosing was started when tumors were palpable. Dosing schedule indicated by horizontal bars on graph was first 2 weeks (from day 33 to 46) 10 mg/kg, third week (from day 47 to 54) 15 mg/kg, fourth week (from 55 to 66) first 3 days 20 mg/kg, 2 days break, then alternate days from day 60 to 66. GBM4 tumor growth was inhibited after treatment with SKOG102 when compared vehicle treated group. Error bar represent mean standard deviation, * indicates p = 0.02 between vehicle control and SKOG102 treated group. D. Brain concentration of SKOG102. Mice were injected with 5 mg/kg intraperitoneally and the graph indicates the brain concentration at 1 and 4 hours. E. Intracranial tumor study. GBM4 cells were pretreated with SKOG102 or vehicle control for 14 h, only viable cells were injected intracranially into NSG mice (n = 8). Tumor volumes were measured using MRI after 4 weeks. Bar graph indicates tumor volumes, error bars represent mean ± standard deviation, * indicates p < 0.05 between vehicle control and SKOG102. F. Renderings of mouse brain tumors imaged with contrast enhanced MRI, where cells were pretreated with DMSO vehicle (upper panels) and SKOG102 (lower panels), and viable cells were injected intracranially into NSG mice. Area of the enhanced relative intensity was color coded to produce a 3D model of the extent and distribution of the tumor cells in the brain tissue.
