
Figure 1. Kaplan-Meier Survival curves: The overall and cancer-caused specific survival of patients with gastric cancer according to marital status, unmarried versus married patients.
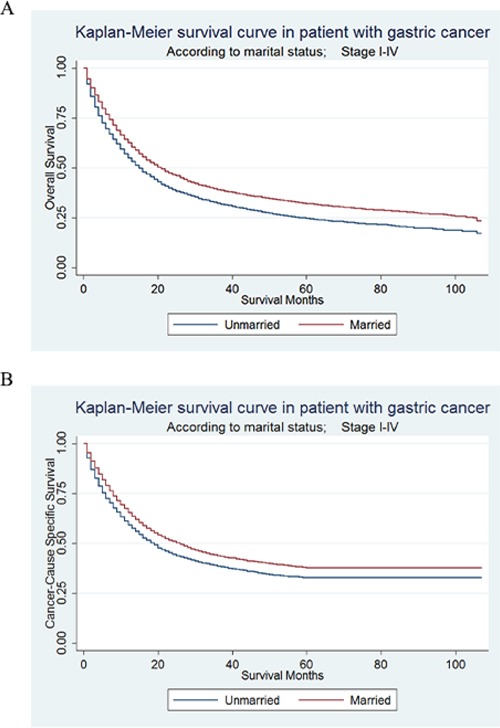
A. OS: χ2= 121.4, P<0.001; B. CSS: χ2= 66.42, P<0.001.
Official websites use .gov
A
.gov website belongs to an official
government organization in the United States.
Secure .gov websites use HTTPS
A lock (
) or https:// means you've safely
connected to the .gov website. Share sensitive
information only on official, secure websites.
A. OS: χ2= 121.4, P<0.001; B. CSS: χ2= 66.42, P<0.001.