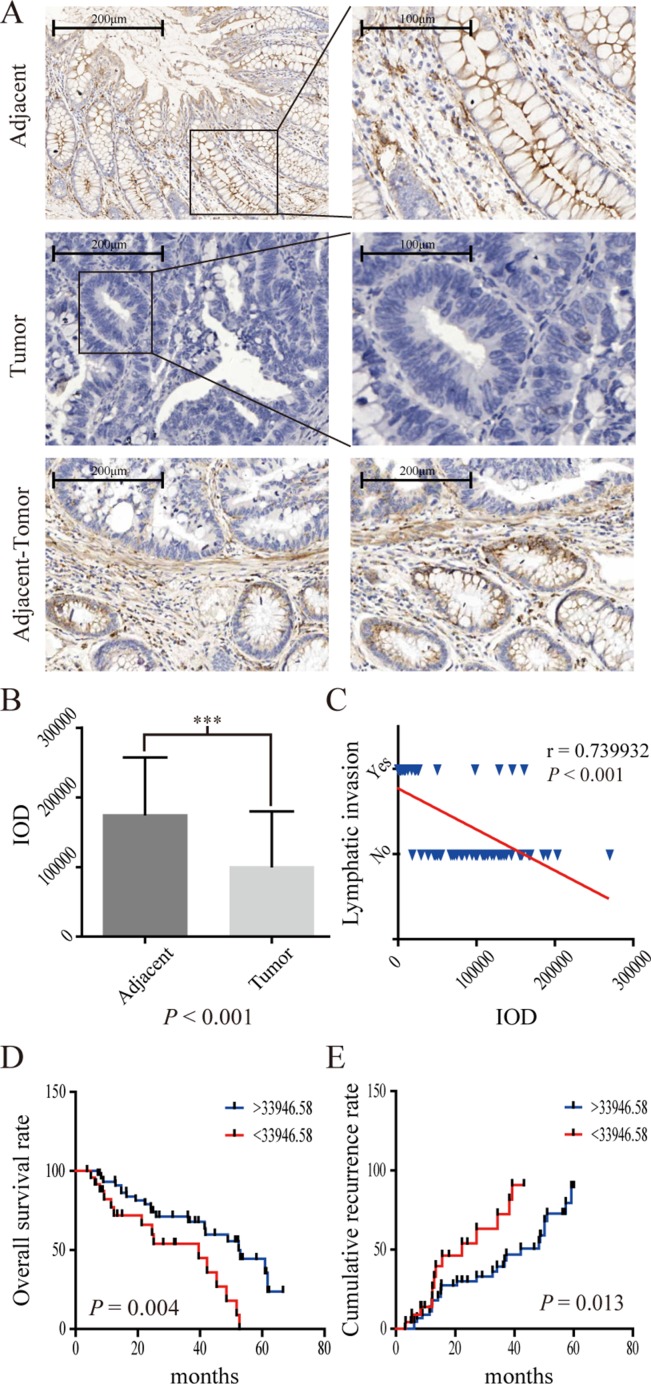
Figure 4. IHC results of CPM in 70 pairs of CRC specimens.
(A) CPM expression in adjacent specimens, CRC specimens and adjacent-tumor tissues; (B) IOD (integrated optical density) results of CPM expression in 70 pairs of specimens. (C) CPM expression was negatively correlated with lymph node invasion in 70 pairs of specimens. (D) Survival curve of 70 CRC patients. The blue line represents increased CPM expression (IOD > 33,946.58), whereas the red line represents reduced CPM expression (< 33,946.58). (E) Recurrence curve of 70 CRC patients. The blue line represents reduced CPM expression (IOD > 33,946.58), whereas the red line represents increased CPM expression (< 33,946.58).

